Upload date
All time
Last hour
Today
This week
This month
This year
Type
All
Video
Channel
Playlist
Movie
Duration
Short (< 4 minutes)
Medium (4-20 minutes)
Long (> 20 minutes)
Sort by
Relevance
Rating
View count
Features
HD
Subtitles/CC
Creative Commons
3D
Live
4K
360°
VR180
HDR
70,688 results
OrderFlow IQ - The Ultimate Order Flow & Volume Suite for TradingView Update: Access or tools referenced in this video are no ...
6,729 views
2 months ago
There are 3 lines that make up the Bolling Bands. The middle line is usually the 20-day simple moving average, the 20SMA.
1,355 views
2 years ago
Download ATAS for free with full functionality: https://web.atas.net/atas-download-041225 Tired of false breakouts and "invisible" ...
8,894 views
1 month ago
This video is my take on a popular Stocks Trading known as THE ANTI method. The variation of this technique that I will cover ...
5,513 views
1 year ago
The 30MIN Engulfing Candlestick Trading Strategy That I Trade Every Week… Learn the powerful "engulfing candlestick" trading ...
26,139 views
Subscribe to TradeDots: https://bit.ly/tradedots Our Telegram Channel (Free Signals): https://t.me/tradedots_official/ Follow us on ...
405 views
Ashi-Algo - Precision Trading with Heikin-Ashi Logic Update: Access or tools referenced in this video are no longer available.
43,556 views
4 months ago
MILLION DOLLARS TRADING TOOLBOX ⚒️ Download the Trading journal, the risk smart tools, and finally the indicators and ...
56,712 views
7 years ago
Why do markets reverse? One of the most common reasons is the double-top exhaustion pattern. Get started with Bookmap for ...
24,532 views
How to use the Volatility Stop and the Trendenator Indicators ✓Try Right Way Options -http://bit.ly/RWO60daytrial ✓ Save $25 on ...
19,843 views
6 years ago
A walk though the mechanics of how to use the NEW Auto Harmonics Trading Indicator for the Tradingview Platform. Including ...
2,348 views
5 years ago
Get a free workspace template for this strategy: https://web.atas.net/rain-chart-template And don't forget to download ATAS ...
51,158 views
11 months ago
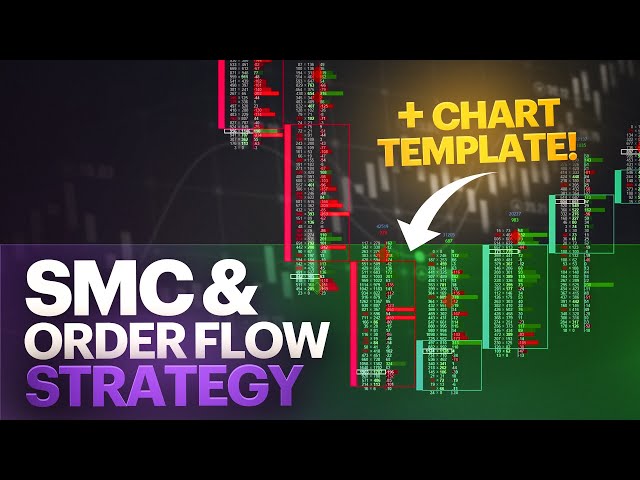
Get a free workspace template for this strategy: https://web.atas.net/smc-template And don't forget to download ATAS platform ...
51,780 views
3 months ago
Access The Trading Community ▻ https://freedomcharts.co/vsl-page-page Up to 20 Free Shares! Start Trading Here ...
128,734 views
Real-time Trend Reversal Indicator for Intraday and Swing Trading Welcome to KumarSingh, your ultimate destination for ...
1,386 views
Welcome to KumarSingh's official YouTube channel! In this video, we bring you a comprehensive guide to chart patterns in ...
24,628 views
If you enjoyed this video and want more exclusive content, join our PREMIUM Forum starting from just $74 per month!
24,542 views
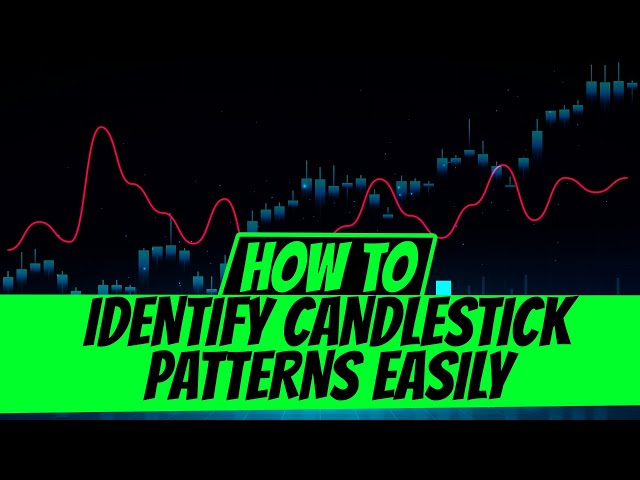
How to identify candlestick patterns easily with this forex indicator. Candlestick analysis can be difficult and thus this indicator is ...
739 views
The Next Pivot IQ is a groundbreaking TradingView indicator that forecasts future price movements by matching current market ...
1,372 views
Here's an example of reading an order flow footprint chart to qualify a setup and entry on the S&P 500.
270,895 views