Upload date
All time
Last hour
Today
This week
This month
This year
Type
All
Video
Channel
Playlist
Movie
Duration
Short (< 4 minutes)
Medium (4-20 minutes)
Long (> 20 minutes)
Sort by
Relevance
Rating
View count
Features
HD
Subtitles/CC
Creative Commons
3D
Live
4K
360°
VR180
HDR
93,747 results
Take my Full Power BI Course Here: https://www.analystbuilder.com/courses/microsoft-power-bi-desktop-for-business-intelligence ...
209,118 views
3 years ago
Dr Jie Jang was presenting at the 8th ESRC Research Methods Festival, 3rd - 5th July 2018 at the University of Bath. The Festival ...
272 views
7 years ago
Introduction to network analysis and visualization with GEPHI. Datasets and tutorial here: ...
108,130 views
In this video we take a look at the best resources to learn Data Visualization in 2025! 25% off Analyst Builder Code: ...
15,373 views
7 months ago
As soon as you go beyond the typical bar and line charts and start creating bespoke data visualisations, different screen sizes ...
387 views
Streamed 5 years ago
A short film describing the development of a prototype application for the Oculus Rift DK2 headset, to visualise subsurface ...
8,045 views
10 years ago
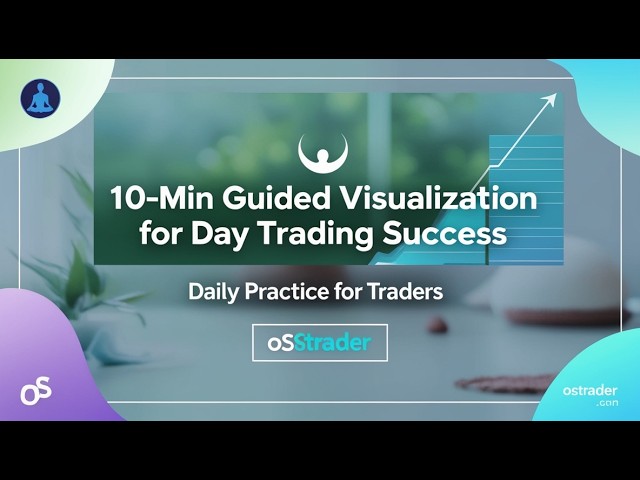
Day Trading Mastery Blog: https://osstraderblog.online/ Hey Sniper Squad! Welcome to our daily visualization session designed to ...
629 views
1 year ago
Viruses are beautiful in their symmetry and complexity. 3D visualisations of complex biological data are crucial for research and ...
31,943 views
Click the Link below : https://mindandgutwellness.com/ Send Whatsapp message ''Hello"' To 7039111233 Click the Link below ...
63,718 views
4 months ago
Visualization Technique. LET GO of Fear, Anxiety and Worry. The power of visualization is incredible and life changing. You can ...
1,522 views
5 years ago
Impressive visualisations of computer simulations! 12 years ago, at the BSC Data Analytics and Visualization Group, we started ...
737 views
Researching Educational Technologies: Consensus Analysis.
4 views
2 years ago
A short introduction to using visualization to analyze networks, for the Social Media Research Foundation Summer School 2021.
823 views
4 years ago
Talk by Fabian Neumann (https://www.neumann.fyi/), links to repositories: code: https://github.com/fneum/streamlit-tutorial ...
1,409 views
Take my Full Python Course Here: https://www.analystbuilder.com/courses/pandas-for-data-analysis In this series we will be ...
113,239 views
Hello everyone! In todays video I want to show you how you can use Obsidian for data visualization by using Obsidian Charts, ...
24,466 views
"SciBlend: Advanced Data Visualization Workflows" by José Marín at Blender Conference 2025 Scientific data visualization is ...
3,042 views
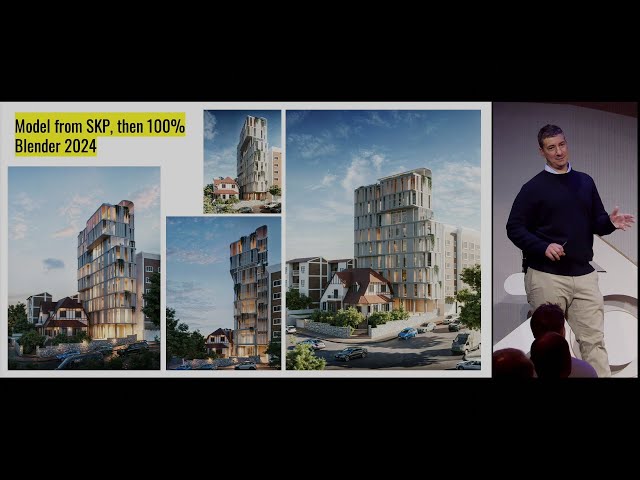
"Architectural Visualization Pipelines" by Pato Calvelo Blender Conference 2024 2024-10-24 at the Felix Meritis, Amsterdam, ...
10,769 views
The 6th Demo Session covered all the basics around our own visualization tool - Leonardo. Follow along as we show you an ...
2,436 views