Upload date
All time
Last hour
Today
This week
This month
This year
Type
All
Video
Channel
Playlist
Movie
Duration
Short (< 4 minutes)
Medium (4-20 minutes)
Long (> 20 minutes)
Sort by
Relevance
Rating
View count
Features
HD
Subtitles/CC
Creative Commons
3D
Live
4K
360°
VR180
HDR
6,991 results
Graphillion is a Python module to efficiently manipulate a number of, even x-illions of, graphs for heavy graph problems like ...
1,082 views
Streamed 12 years ago
This course was designed to help you get started using Plotly. If you ever felt like your data visualization skills could use an ...
1,899 views
4 years ago
Take my Full Python Course Here: https://www.analystbuilder.com/courses/pandas-for-data-analysis In this series we will be ...
115,417 views
2 years ago
Example of an animation with various subplots and axes using Python and Matplotlib.
21,491 views
13 years ago
Did you know that in Python you can easily draw a graph in just a few lines of code? #python #programming #pythonprogramming ...
350 views
8 months ago
Getting started with matplotlib. Introduction to matplotlib. How to create a 3D plot using matplotlib? How to draw a 3D scatter plot ...
2,082 views
3 months ago
Welcome to this Python project tutorial where we dive into the fascinating world of data visualization! In this video, we will guide ...
5 views
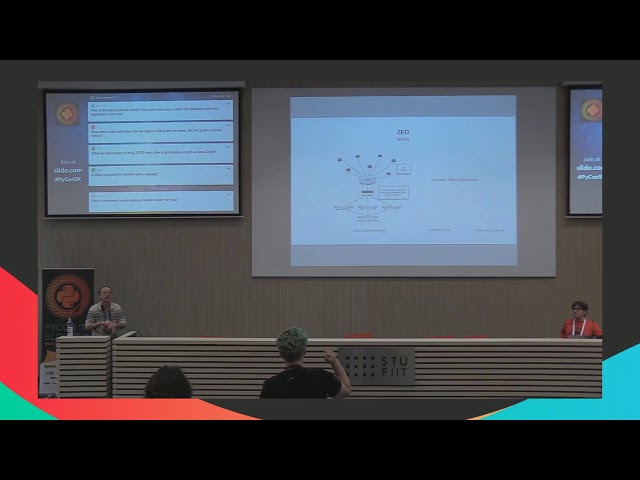
he ZODB is a mature graph database written in Python and optimized in C. Just subclass off of class Persistent Object, and ...
452 views
7 years ago
This is the seventeenth lecture in the Probabilistic ML class of Prof. Dr. Philipp Hennig in the Summer Term 2020 at the University ...
21,493 views
5 years ago
Strengthen your skills in algorithmics and graph theory, and gain experience in programming in Python along the way. To follow ...
8,347 views
One of the simplest ways to programmatically generate graph visuals is GraphViz. This video explains the basics of GraphViz ...
72,978 views
Here we go with the series on plotting in python. Matplotlib is a well-known library used for plotting purposes. The series is made ...
74 views
3 years ago
Aileen Nielsen https://2016.pygotham.org/talks/368/probabilistic-graphical-models-in-python This talk will give a high level ...
33,246 views
9 years ago
Join us: https://discord.gg/sZkePhaWSZ --- The speaker shares their experience with programming interviews, discussing specific ...
81 views
1 year ago
In this video, I am using https://infranodus.com to generate a knowledge graph using LLM. I will show you how you can build a ...
10,683 views
10 months ago
3,191 views
"Graph Databases: Talking about your Data Relationships with Python [EuroPython 2017 - Talk - 2017-07-14 - PyCharm Room] ...
900 views
8 years ago
Code Review: Adjacency List Graph representation on python Helpful? Please support me on Patreon: ...
6 views
233,452 views
3,646 views
3,739 views
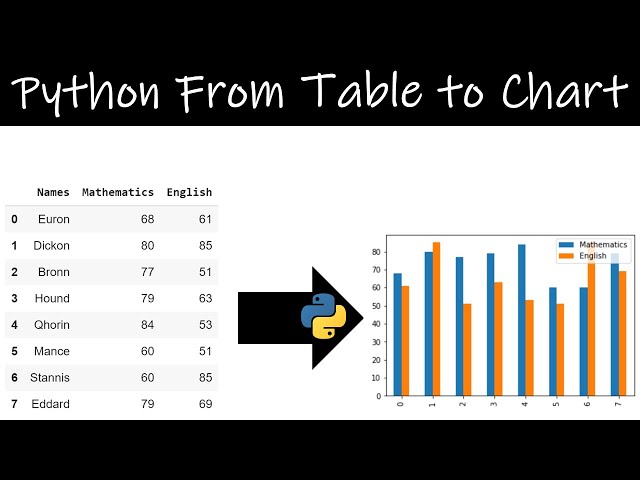
Plot Table Data to Chart Pandas Library Dataframe multiple colum graph plot Python.
209 views
The ZODB is an object-oriented database written in Python and optimized in C. Just subclass off of class Persistent Object, and ...
803 views
4,805 views
539,734 views

![Plotly 101 - Graph Objects Intro & Figure Object - [Part 6/8]](/api/proxy/image?url=https%3A%2F%2Fi.ytimg.com%2Fvi%2FsrIU-QglaB0%2Fsddefault.jpg)


![Plotly 101 - Graph Objects, Adding Traces to Figures - [Part 7/8]](/api/proxy/image?url=https%3A%2F%2Fi.ytimg.com%2Fvi%2FNQHcs-rIoVk%2Fsddefault.jpg)
