Upload date
All time
Last hour
Today
This week
This month
This year
Type
All
Video
Channel
Playlist
Movie
Duration
Short (< 4 minutes)
Medium (4-20 minutes)
Long (> 20 minutes)
Sort by
Relevance
Rating
View count
Features
HD
Subtitles/CC
Creative Commons
3D
Live
4K
360°
VR180
HDR
419 results
This video covers the subplot command in Matlab. All the code shown works perfectly in Octave as well. This video is part of a ...
506 views
2 years ago
Virginia Tech ME 2004: Subplots in MATLAB This video plots the charge on a capacitor over time in an RLC circuit using MATLAB ...
2,185 views
3 years ago
In this video, we are going to cover SUBPLOT, HOLD ON, HOLD OFF, HOLD ALL,LINSPACE BUY MATLAB ...
5,764 views
5 years ago
An introduction to the object oriented API and a discussion of ways to make grids of figures and inset plots.
461 views
Example of an animation with various subplots and axes using Python and Matplotlib.
21,494 views
13 years ago
... is where matplotlib happens to have the ability of scatter post not scatter plots subplots the entire idea is oh well I'm gonna make ...
918 views
GSBmE MATLAB Introduction Video Tutorial 5: figure; Figure handle, plot(x,y), hold on; hold off; Changing marker type and style, ...
5,942 views
12 years ago
We learn how to make a Matplotlib figure in Python with mutiple subplots inside it. Summary: - Using plt.subplots(), we can ...
961 views
4 years ago
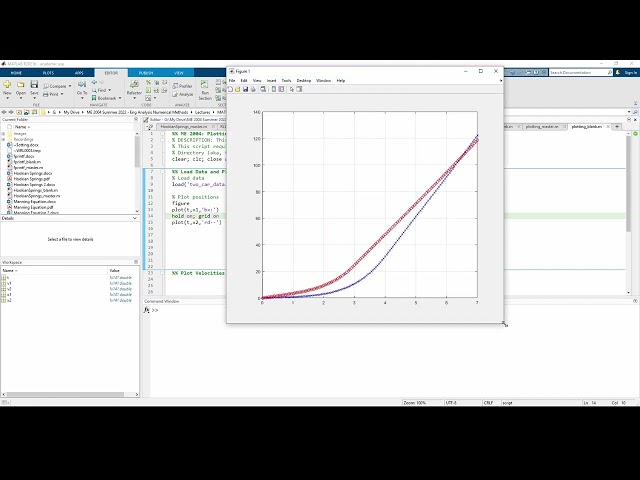
Virginia Tech ME 2004: Plotting in MATLAB This video demonstrates various ways to plot simple data in MATLAB. Blank .m file: ...
3,175 views
This video covers solutions to exercise 7. All the code works in Octave with minor adjustments that are noted in the video.
Demonstrates how to plot two series of data in a single subplot within a figure. This is demonstrated for line and bar plots.
132 views
How to make contour plots, heat maps and other 3d plots using matplotlib.
331 views
Realtime Plotting with Python and pylab/matplotlib More info and source code at: ...
30,459 views
14 years ago
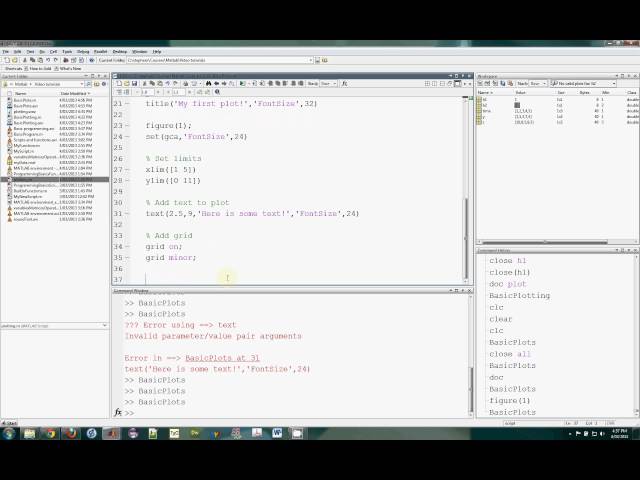
This video covers a variety of plotting techniques in Matlab. Much of the code works in Octave. I note which does and does not ...
391 views
This video covers a variety of Matlab functions for plotting symbolic expressions and equations. The vast majority of this code does ...
860 views
This video covers 3d plotting capabilities in Matlab. All the code shown works perfectly in Octave as well. This video is part of a ...
758 views
Here we show how to enhance the plots.
1,953 views
In this video, I give an overview on making plots and graphs in MATLAB. This is based on lecture notes prepared by Dr. Sonya ...
147 views
3,403 views
More playing with the new sketch mode of matplotlib, now applied to the subplots example.
529 views