ViewTube

ViewTube
Sign inSign upSubscriptions
Filters

Upload date

Type

Duration

Sort by

Features

Reset

110 results

Codanics
Automated EDA in Python with ydata-profiling | Easy Data Analysis Tutorial

You can book One to one consultancy session with me on Mentoga: https://mentoga.com/muhammadaammartufail ...

25:06
Automated EDA in Python with ydata-profiling | Easy Data Analysis Tutorial

648 views

4 months ago

BioniChaos
Bio-Signal Processing: A Deep Dive into EDA Data with Python

Ever wonder why your palms get clammy when you're nervous or excited? That's your nervous system talking, and your skin is ...

13:53
Bio-Signal Processing: A Deep Dive into EDA Data with Python

38 views

4 months ago

Codanics
Day 25: Complete EDA with dTale Library in Python in Seconds | 365 Days of Growing Together

Follow Codanics on WhatsApp for more updates: https://whatsapp.com/channel/0029Va7nRDq3QxRzGqaQvS3r Information ...

14:46
Day 25: Complete EDA with dTale Library in Python in Seconds | 365 Days of Growing Together

566 views

6 days ago

Codanics
Developing a Streamlit App for ydata-profiling: Automated EDA in Python

You can book One to one consultancy session with me on Mentoga: https://mentoga.com/muhammadaammartufail Link to the ...

14:24
Developing a Streamlit App for ydata-profiling: Automated EDA in Python

715 views

4 months ago

AbishGamesPlays
Live Coding: Python Basics & Intro to Data Analysis with NumPy

"Welcome to my live coding session! As a first-year Data Science Engineering student, I'll be sharing my journey through the ...

3:27:45
Live Coding: Python Basics & Intro to Data Analysis with NumPy

24 views

Streamed 8 months ago

Alex The Analyst
What is Healthcare Analytics?

In this video we are talking all about Healthcare Analytics! I worked in Healthcare Analytics for over 6 years and I hope that my ...

10:56
What is Healthcare Analytics?

38,722 views

11 months ago

Venkata Reddy AI Classes
Python Visualizations | Video 6 | Part 1 | Python Made Easy

Code File: https://colab.research.google.com/drive/1MaSrp8hn7gy-Zbd1pmCOSK8HoPFQpmOE Access the full playlist Python ...

33:44
Python Visualizations | Video 6 | Part 1 | Python Made Easy

329 views

11 months ago

NYC Open Data Week
One Tool for All Your Public (or Private) Data Extraction Needs

NYC Open Data Week 2025 As data analysts and engineers know, quality source data is crucial to sound analyses and healthy ...

35:12
One Tool for All Your Public (or Private) Data Extraction Needs

38 views

4 months ago

PythonPH
PyCon APAC 2025 - DNA for Data: Python-Powered Bioinformatics... by Samantha Vivien L. Servo

... discussing about DNA for data python powered bioinformatics for solving local challenges So our agenda for this afternoon will ...

31:24
PyCon APAC 2025 - DNA for Data: Python-Powered Bioinformatics... by Samantha Vivien L. Servo

53 views

8 months ago

Codanics
Day 24: EDA Project with Pandas and ydata-profiling on any data | 365 Days of Growing Together

Follow Codanics on WhatsApp for more updates: https://whatsapp.com/channel/0029Va7nRDq3QxRzGqaQvS3r Information ...

23:03
Day 24: EDA Project with Pandas and ydata-profiling on any data | 365 Days of Growing Together

695 views

6 days ago

NHS-R Community
NHS-R Coffee and Coding - exploratory data analysis and twirly text

10 January 2025 Show and tells from Simon Wellesley-Miller on exploratory data analysis reports and twirly text. Repositories for ...

49:03
NHS-R Coffee and Coding - exploratory data analysis and twirly text

377 views

11 months ago

Satish Choudhary
Exploratory Data Analysis Python or Jupyter Notebook

Why Performs EDA and basic Function in Jupyter Notebook #shape, #info, #corr, #describe and many more function.

13:00
Exploratory Data Analysis Python or Jupyter Notebook

85 views

11 months ago

Deeium
Day 31   EDA Project 1
57:55
Day 31 EDA Project 1

1 view

12 days ago

R for Data & Fun
Data Cleaning for Dates

This video demonstrates how to analyze the correlation between a date variable and the target variable prior to building a ...

11:28
Data Cleaning for Dates

21 views

11 months ago

EuroPython Conference
Meet Marimo, the next-gen Notebook — Sven Arends

EuroPython 2025 — Forum Hall on 2025-07-17] *Meet Marimo, the next-gen Notebook by Sven Arends* ...

29:52
Meet Marimo, the next-gen Notebook — Sven Arends

801 views

2 months ago

AnalyticsSorcery
How to Link SQL to Python FAST with SQLite (Copy Paste Trick Data Scientists Love)

How to Link SQL to Python? In this video, I'll show you how to use SQLite—a built-in, serverless SQL engine in Python—to run ...

10:18
How to Link SQL to Python FAST with SQLite (Copy Paste Trick Data Scientists Love)

43 views

6 months ago

PythonDeep
Exploración de Datos con PANDAS: Tu primer paso en el Análisis en Python

Explora tus datos con pandas como un profesional en este tutorial en español. Aprenderás a usar métodos fundamentales como ...

22:43
Exploración de Datos con PANDAS: Tu primer paso en el Análisis en Python

32 views

6 months ago

The Statistics Lab
HADC 2025 12 09 197 Visualising survey data in R

This is a live recording of our weekly meeting. We discuss R and Python Programming, statistics, work through tutorials, practice ...

57:57
HADC 2025 12 09 197 Visualising survey data in R

8 views

1 month ago

The Statistics Lab
HADC! 2025-10-21 (Meeting #190) Using AI to analyse your data (Ed H)

This is a live recording of our weekly meeting. We discuss R and Python Programming, statistics, work through tutorials, practice ...

1:04:26
HADC! 2025-10-21 (Meeting #190) Using AI to analyse your data (Ed H)

13 views

2 months ago

Deep Wing
Palantir Explained: Data Integration, Analytics & Decision-Making with Foundry & Gotham

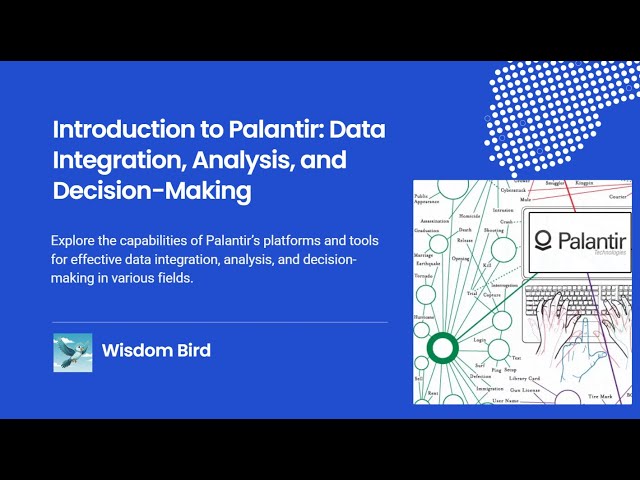
Unlock the power of Palantir—a leading platform for data integration, advanced analytics, and real-time decision-making.

17:37
Palantir Explained: Data Integration, Analytics & Decision-Making with Foundry & Gotham

706 views

9 months ago

Deeium
Day 33  EDA Project 3
51:35
Day 33 EDA Project 3

1 view

12 days ago

The Debug Zone
Python Seaborn: How to Plot Frequencies Including Zero-Values in Charts

In this video, we dive into the powerful data visualization library Seaborn, focusing on how to effectively plot frequency ...

1:41
Python Seaborn: How to Plot Frequencies Including Zero-Values in Charts

4 views

3 months ago

UK DATA SERVICE
Working with Reddit data

This free workshop will introduce the fundamentals of natural language processing (NLP) and sentiment analysis, using Reddit as ...

1:21:52
Working with Reddit data

156 views

1 month ago

The Debug Zone
How to Randomly Select Columns from a DataFrame in Python Pandas

In this video, we'll explore a powerful technique for working with data in Python using the Pandas library. Specifically, we'll focus ...

1:38
How to Randomly Select Columns from a DataFrame in Python Pandas

0 views

1 month ago

Charles Niswander
Getting Started with Pandas

Ever felt like you were drowning in a spreadsheet? In Module 3 of our Data Science series, we leave the limitations of ...

7:17
Getting Started with Pandas

4 views

2 months ago