Upload date
All time
Last hour
Today
This week
This month
This year
Type
All
Video
Channel
Playlist
Movie
Duration
Short (< 4 minutes)
Medium (4-20 minutes)
Long (> 20 minutes)
Sort by
Relevance
Rating
View count
Features
HD
Subtitles/CC
Creative Commons
3D
Live
4K
360°
VR180
HDR
77 results
Chapters: 00:00:37 1. Understanding Subplots 00:01:01 2. Setting Up the Plotting Grid 00:01:23 3. Plotting the First Three ...
1 view
13 days ago
A practical Jupyter Notebook demonstrating how to create and customize multiple subplots using Matplotlib. Covers layout ...
0 views
5 days ago
Introduction to Histograms in Matplotlib: Master Data Distribution Visualization & Implementation #matplotlib #datavisualization ...
63 views
7 days ago
A Jupyter Notebook showcasing different kinds of plots using Matplotlib — including line, bar, scatter, histogram, box plot, and ...
1 day ago
In this video, you will learn how to create subplots in modern Matplotlib using Python. Agar aap single page (single figure) me ...
9 days ago
In this hands-on Matplotlib coding workshop, you will learn data visualization from scratch using Python by building charts live, ...
23 views
10 days ago
In this tutorial video, I'll provide multiple examples to show you custom subplots and how to create them.Subplots in Matplotlib ...
16 views
Bring your scientific data to life with animated visualizations! Learn how to create professional animations in Python using ...
35 views
2 weeks ago
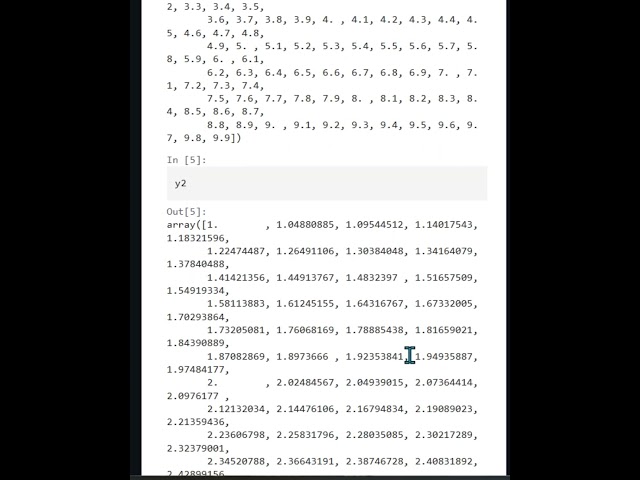
Chapters: 00:00:25 1. Preparing X and Y Data 00:00:57 2. Generating the Plot 00:01:24 3. Displaying the Plot (`plt.show`) ...
2 views
Mastering Advanced Matplotlib Techniques.
8 days ago
Mark Attendance & Submit Assignment at One Place → https://luc.to/vddec25d1 Join Data Science Discussion group to get daily ...
66 views
In this video, we explore Matplotlib, one of the most powerful and popular libraries in Python for creating data visualizations.
26 views
Chapters: 00:00:32 1. Preparing Data for Scatter Plot 00:01:00 2. Generating the Basic Scatter Plot 00:01:22 3. Controlling Point ...
Welcome to the Matplotlib Hands-On Coding Workshop! In this session, we will learn data visualization from scratch using Python ...
19 views
Chapters: 00:00:25 1. Project Setup and File Creation 00:00:45 2. The Essential Imports 00:01:17 3. Writing the Project Boilerplate ...
Learn how to use Matplotlib, a leading Python library for creating a wide range of visualizations. This tutorial covers everything ...
11 views
3 weeks ago
Chapters: 00:00:30 1. Defining Overlapping Data 00:00:58 2. Using `alpha` for Transparency 00:01:37 3. Adding a Legend ...
Chapters: 00:00:28 1. What is Matplotlib? 00:00:50 2. Why Visualize Data? 00:01:19 3. The Pyplot Module 00:01:45 4.
Link: https://darekdari.com/matplotlib-guide-python/ In this video, you'll learn Matplotlib in Python from scratch, perfect for ...
6 views
4 weeks ago
Chapters: 00:00:25 1. Setup: Basic Line Plot Data 00:00:44 2. Customizing Line Color and Style 00:01:22 3. Adding a Grid ...
![[Python for Beginners]: 37.09. Matplotlib: Plotting Sub Plots](/api/proxy/image?url=https%3A%2F%2Fi.ytimg.com%2Fvi%2F-soCBub-Qbs%2Fsddefault.jpg)


![[Python for Beginners]: 37.03. Matplotlib: Generate Line Plot](/api/proxy/image?url=https%3A%2F%2Fi.ytimg.com%2Fvi%2F4AHLDml1NBs%2Fsddefault.jpg)


![[Python for Beginners]: 37.06. Matplotlib: Generate Scatter Graph](/api/proxy/image?url=https%3A%2F%2Fi.ytimg.com%2Fvi%2FAiiCmH7QAyU%2Fsddefault.jpg)
![[Python for Beginners]: 37.02. Matplotlib: Create Project](/api/proxy/image?url=https%3A%2F%2Fi.ytimg.com%2Fvi%2F28Ph9wfQ7LQ%2Fsddefault.jpg)

![[Python for Beginners]: 37.05. Matplotlib: Control Transparency](/api/proxy/image?url=https%3A%2F%2Fi.ytimg.com%2Fvi%2FzIzaboSh7Dw%2Fsddefault.jpg)
![[Python for Beginners]: 37.01. Matplotlib: Introduction](/api/proxy/image?url=https%3A%2F%2Fi.ytimg.com%2Fvi%2FTsp1MBjMN9w%2Fsddefault.jpg)

![[Python for Beginners]: 37.04. Matplotlib: Add Color and Grid](/api/proxy/image?url=https%3A%2F%2Fi.ytimg.com%2Fvi%2FqyBcmK5p688%2Fsddefault.jpg)