ViewTube

ViewTube
Sign inSign upSubscriptions
Filters

Upload date

Type

Duration

Sort by

Features

Reset

152,177 results

Related queries

seaborn python tamil

seaborn heatmap

seaborn python hindi

plotly in python

matplotlib wscube tech

scikit learn wscube tech

NeuralNine
Seaborn Is The Easier Matplotlib

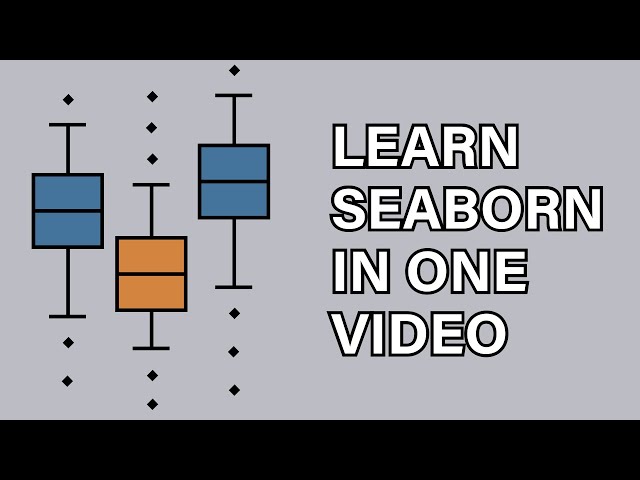
This video is about Seaborn, an external Python data visualization library, which is based on Matplotlib.

22:39
Seaborn Is The Easier Matplotlib

220,828 views

3 years ago

Derek Banas
Seaborn Tutorial : Seaborn Full Course

New Data Science / Machine Learning Video Everyday at 1 PM EST!!! [ Click Notification Bell ] This video provides complete ...

59:34
Seaborn Tutorial : Seaborn Full Course

253,573 views

5 years ago

DsCs
The Ultimate Data Visualization Tools Overview #matplotlib  #seaborn  #plotly

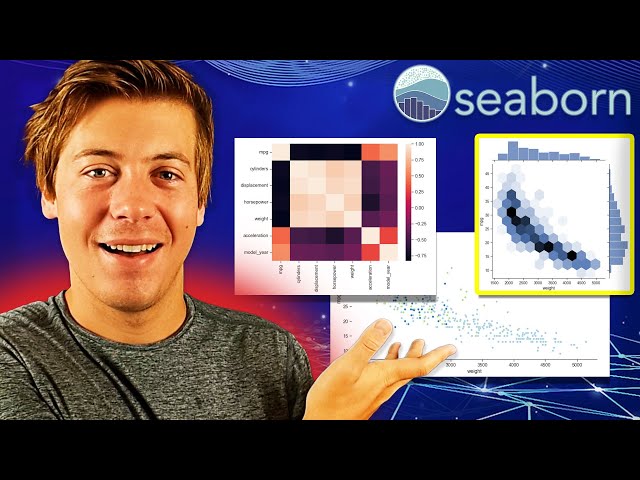
In this video, we dive deep into the world of data visualization in Python using three powerful libraries: Matplotlib, Seaborn, and ...

0:51
The Ultimate Data Visualization Tools Overview #matplotlib #seaborn #plotly

1,486 views

1 year ago

People also watched

The Wular Academy
PYTHON IN EXCEL: Data Analysis & Visualization with Pandas & Seaborn.

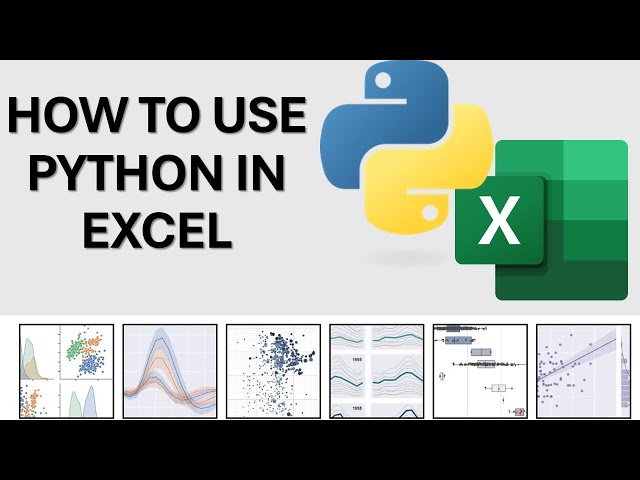
See how Python is transforming Excel into a data powerhouse. In this video, we'll demonstrate: • The groundbreaking PY function ...

22:00
PYTHON IN EXCEL: Data Analysis & Visualization with Pandas & Seaborn.

4,582 views

7 months ago

Data Science For Everyone
Exploratory Data Analysis in Python | pandas, numpy, matplotlib, seaborn

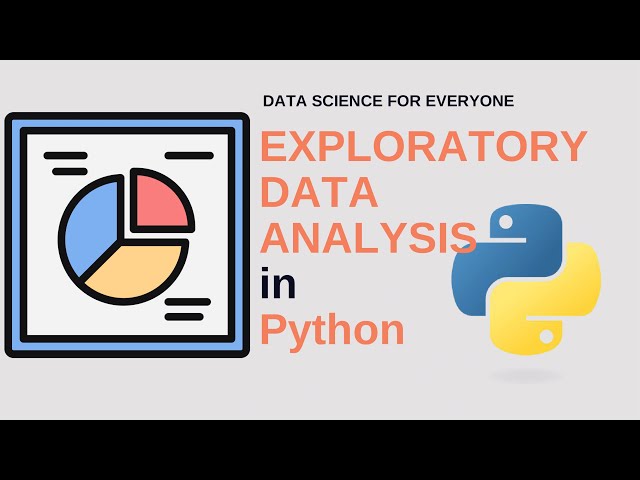
In this video, we dive into Exploratory Data Analysis (EDA) using powerful Python libraries like pandas, numpy, matplotlib, and ...

25:29
Exploratory Data Analysis in Python | pandas, numpy, matplotlib, seaborn

3,211 views

6 months ago

NeuralNine
Is Plotly The Better Matplotlib?

In this video we take a quick look at the Plotly framework in Python. At the end we compare it to Matplotlib.

22:58
Is Plotly The Better Matplotlib?

104,849 views

4 years ago

Charming Data
Introduction to Dash Plotly - Data Visualization in Python

An introduction to the Dash web application framework. Dash is used to create browser-based interactive data visualization ...

29:21
Introduction to Dash Plotly - Data Visualization in Python

853,700 views

5 years ago

Kimberly Fessel
Seaborn heatmap | How to make a heatmap in Python Seaborn and adjust the heatmap style

The Seaborn heatmap is a simple visual that allows you to display tables of data through color. This Seaborn heatmap tutorial ...

13:03
Seaborn heatmap | How to make a heatmap in Python Seaborn and adjust the heatmap style

72,435 views

5 years ago

Kimberly Fessel
Seaborn Bar Plot Tutorial | How to make and style a barplot with Seaborn Python

Learn about coding the Seaborn bar plot in this tutorial video. I demonstrate how to make a barplot with seaborn and how to make ...

10:00
Seaborn Bar Plot Tutorial | How to make and style a barplot with Seaborn Python

29,829 views

5 years ago

Coding Professor
Top 5 Python Libraries for Data Visualization

In this video, I will provide a high-level overview of the Top 5 Python libraries for Data Visualization that you can use to create ...

11:33
Top 5 Python Libraries for Data Visualization

54,542 views

4 years ago

Matt Macarty
Linear Regression Model Techniques with Python, NumPy, pandas and Seaborn

Python #Regression #NumPy https://alphabench.com/data/python-linear-regression.html ✓ Please SUBSCRIBE: ...

13:46
Linear Regression Model Techniques with Python, NumPy, pandas and Seaborn

77,462 views

4 years ago

Kimberly Fessel
Seaborn histplot | How to make a Seaborn histogram plot with Python code

This Seaborn histogram video shows you how to make a histogram in Python using the Seaborn histplot. I begin by showing you ...

12:39
Seaborn histplot | How to make a Seaborn histogram plot with Python code

35,292 views

5 years ago

Kimberly Fessel
Seaborn distplot | Seaborn distplot interpretation and how to make a distribution plot in seaborn

I then demo how to make a distplot using Python seaborn by walking through the coding basics as well as some advanced styling ...

11:37
Seaborn distplot | Seaborn distplot interpretation and how to make a distribution plot in seaborn

25,616 views

5 years ago

Datademia
Data Visualization with Python - MatplotLib vs. Seaborn

If you work with data in Python, at some point you'll need to visualize it. In this video, I'll show you the differences ...

7:04
Data Visualization with Python - MatplotLib vs. Seaborn

1,527 views

8 months ago

Kimberly Fessel
Introduction to Seaborn | How seaborn Python works with matplotlib along with seaborn and pandas

This first video of my "Introduction to Seaborn" series covers the basics of seaborn, a Python library for data visualization. Here ...

7:27
Introduction to Seaborn | How seaborn Python works with matplotlib along with seaborn and pandas

79,173 views

5 years ago

Intellipaat
Seaborn Full Course | Seaborn Tutorial (Data Visualization) | Python Seaborn One Shot | Intellipaat

This Seaborn Full Course by Intellipaat is your one-stop guide to mastering data visualization in Python using Seaborn. Perfect for ...

48:22
Seaborn Full Course | Seaborn Tutorial (Data Visualization) | Python Seaborn One Shot | Intellipaat

38,813 views

5 months ago

Simplilearn
Python Seaborn Tutorial | Python Seaborn Plots | Python Seaborn Tutorial For Beginners | Simplilearn

"️️ Professional Certificate in AI and Machine Learning, delivered by Simplilearn in collaboration with Purdue University ...

40:44
Python Seaborn Tutorial | Python Seaborn Plots | Python Seaborn Tutorial For Beginners | Simplilearn

52,855 views

4 years ago

Ryan & Matt Data Science
Python Seaborn for Course

Don't miss out! Get FREE access to my Skool community — packed with resources, tools, and support to help you with Data, ...

37:08
Python Seaborn for Course

7,836 views

2 years ago

Rob Mulla
7 Python Data Visualization Libraries in 15 minutes

In this video Rob, a Kaggle Grandmaster, quickly and humorously walks through each of the popular plotting and data ...

15:03
7 Python Data Visualization Libraries in 15 minutes

107,750 views

3 years ago

AnalytiCode
Seaborn Objects Tutorial: Powerful but Frustrating? (Python Data Visualization Deep Dive)

In my last video, I showed how elegant and simple plotnine makes the Grammar of Graphics in Python. This time, I put Seaborn's ...

16:26
Seaborn Objects Tutorial: Powerful but Frustrating? (Python Data Visualization Deep Dive)

325 views

3 months ago

Codigo Maquina
Explora y Visualiza Relaciones Estadísticas con Seaborn de Python: Gráficas de Línea y Dispersión

Para citar este recurso educativo utiliza la siguiente referencia: Gutiérrez-García, J.O. [Código Máquina]. (2022, 1° de Agosto).

53:58
Explora y Visualiza Relaciones Estadísticas con Seaborn de Python: Gráficas de Línea y Dispersión

12,013 views

3 years ago

Greg Hogg
Seaborn Tutorial for Beginners in Python (Data Visualization)

The Colab Notebook: https://colab.research.google.com/drive/1GZTU5pApz-kL79aaFjiSlhu6_Bf1ZDSz?usp=sharing California ...

51:12
Seaborn Tutorial for Beginners in Python (Data Visualization)

6,020 views

3 years ago

Intellipaat
Python Seaborn Tutorial | Data Visualization in Python Using Seaborn | Intellipaat

Intellipaat Python course: https://intellipaat.com/python-certification-training-online/ In this python seaborn tutorial you will what is ...

34:40
Python Seaborn Tutorial | Data Visualization in Python Using Seaborn | Intellipaat

7,601 views

5 years ago