Upload date
All time
Last hour
Today
This week
This month
This year
Type
All
Video
Channel
Playlist
Movie
Duration
Short (< 4 minutes)
Medium (4-20 minutes)
Long (> 20 minutes)
Sort by
Relevance
Rating
View count
Features
HD
Subtitles/CC
Creative Commons
3D
Live
4K
360°
VR180
HDR
151,321 results
This tutorial illustrates how to generate 2D plots in Matlab. Topics and timestamps: 0:00 – Introduction 2:35 – Using the 'plot' ...
175,994 views
7 years ago
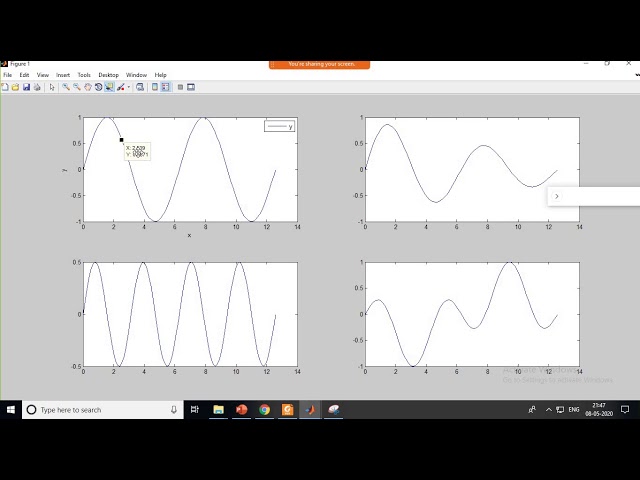
In this MATLAB tutorial video, you'll learn the fundamentals of 2D plotting. In this step-by-step video, I'll guide you through creating ...
5,048 views
2 years ago
http://goo.gl/e65TCX for more FREE video tutorials covering MATLAB Programming This video briefly illustrates how to get 2d ...
5,190 views
10 years ago
Welcome to Laplace Academy. In this tutorial we're going to discuss 2D plotting in MATLAB. The main command that we are ...
706 views
3 years ago
Learn different types of 2-Dimensional Plots in MATLAB with applications. Visualize all the 2-D Graphs with this MATLAB video.
1,614 views
9 years ago
I hope this will be helpful for you :)
128,756 views
In this MATLAB tutorial, you will learn how to plot multiple 2D graphs using simple plot commands. This method allows you to ...
328 views
9 months ago
Built-in Functions in MATLAB In this video, we learn how to draw plot of a function or a variable in MATLAB command window.
499 views
Engineers and scientists often work with complex, multidimensional data that is difficult to interpret in raw tables. Surface plots in ...
2,031 views
2 months ago
matlab #matlabtutorial #graphs In this Tutorial, you will learn basic commands about data plotting in Matlab. The agenda of this ...
653 views
5 years ago
122 views
8 months ago
This video lets you know about 2d and 3d plots in matlab.For more info visit https://www.matlabsolutions.com/
401 views
4 years ago
How exel data is imported in matlab, how to plot imported exel data in matlab, how to plot experimental data and on the same plot ...
102,782 views
Learn how to use tiledlayout to create subplots in MATLAB. tiledlayout creates a tiled chart layout for displaying multiple plots in ...
28,490 views
More info: https://matrixlab-examples.com/matlab-plot-2tier.html https://matrixlab-examples.com/sitemap.html Download ...
6,004 views
Data Scientist Masters Program (Discount Code - YTBE15) ...
4,662 views
This video will cover 2D plot animations. These are basically 2D plots that are displayed one after another to create an animation.
2,324 views
6 years ago
How to Make a 2D Scatter Plot in MATLAB! Change datapoint size and color, in addition to plotting on the x and y axis.
9,010 views
So here we can now start plotting this is a MATLAB command window so next one or two sessions are going to play on the ...
269 views
This video shows the two main 2D function plotting functions imagesc() and pcolor() and goes on to show how to dress up plots in ...
34,775 views
Lecture 3 MATLAB 2D arrays and 3D plotting MM1CPM.
673 views
The video talks about how in MATLAB you could go about doing line plotting for both 2D curves and 3D curves. It is for people ...
16,214 views
A practical guide on how to plot a filled contour figure for your research data using Matlab? #AZ_Physics_and_Mathematics ...
5,471 views
Okay for this screencast we are going to go over something called plotting So I'm just going to make sure that plotting is not built in ...
945 views
11 years ago
In this video: 0:30 Creating x values as a row vector 1:35 Plot function 1:50 Title and labels 2:49 Defining the axis 4:41 Plot a ...
4,520 views