Upload date
All time
Last hour
Today
This week
This month
This year
Type
All
Video
Channel
Playlist
Movie
Duration
Short (< 4 minutes)
Medium (4-20 minutes)
Long (> 20 minutes)
Sort by
Relevance
Rating
View count
Features
HD
Subtitles/CC
Creative Commons
3D
Live
4K
360°
VR180
HDR
10,207,993 results
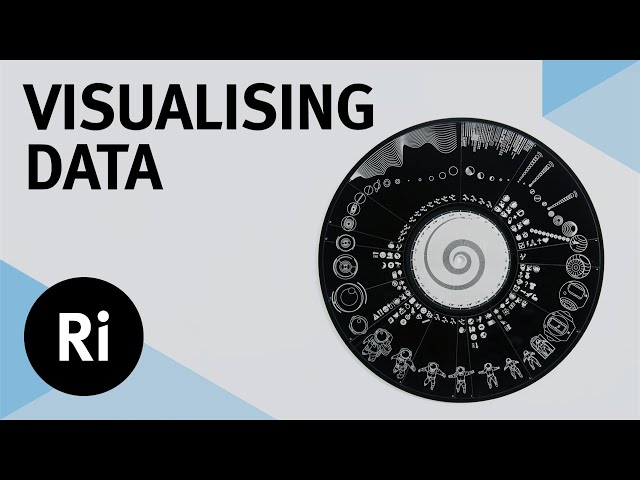
Effective data visualisation comes in many shapes and sizes, but how do you move away from a standard bar chart? Watch the ...
80,663 views
5 years ago
Let's look at how we can implement design concepts and techniques to maximize the impact of our dashboards and reports.
90,470 views
You've probably heard the term data visualization thrown around a lot. It's why you're here, isn't it? So let's make it clear — data ...
188,715 views
4 years ago
MENTORSHIP – Applications for the next cohort are open! Apply here → https://theanalyticsaccelerator.com/ We're looking for ...
61,860 views
1 year ago
Nano Banana + Gemini 3: The Data Visualization Workflow You Need | Stop Making Boring Charts – Use This Nano Banana + ...
26,867 views
5 months ago
Links mentioned in this video ⬇️ Exercise File ...
255,599 views
3 years ago
View full lesson: http://ed.ted.com/lessons/david-mccandless-the-beauty-of-data-visualization David McCandless turns complex ...
1,585,413 views
13 years ago
In this video, I break down some of the 'science' behind effective data visualization and how you can build better dashboards by ...
389,108 views
Following a look at 'Sensemaking' Associate Professor Dr Kai Xu delves into some more tricks of the visualisation trade.
75,661 views
Dustin hopes that the audience learns how anyone can use data visualization to improve their work, understand their world, and ...
74,852 views
12.5K subscribers
Setup, conflict, resolution. You know right away when you see an effective chart or graphic. It hits you with an immediate sense of ...
658,316 views
6 years ago
Find out how data visualization transforms the way we consume information—and why it's such a powerful force in marketing and ...
175,532 views
14 years ago
This comprehensive tutorial will teach you everything you need to know about Excel chart types, chart customization, and creating ...
117,368 views
Watch this mini-workshop delivered by best-selling author Cole Nussbaumer Knaflic. Cole demonstrates how to transform graphs ...
340,788 views
Streamed 2 years ago
Welcome to the Complete Data Visualization in Python Course! In this full video tutorial, we're diving deep into the world of ...
153,822 views
Data visualization is present in every aspect of our lives - but is it really as unbiased as it's said to be? In this SciToons video, learn ...
145,590 views
7 years ago
Viewers like you help make PBS (Thank you ) . Support your local PBS Member Station here: http://to.pbs.org/Donateoffbook ...
514,573 views
Learn Python quickly and easily in 8 minutes and 32 seconds. I'll explain the features and fundamentals of today's most ...
271,745 views
Got 40 minutes? You can learn R and still have time for high fives afterwards. If this vid helps you, please help me a tiny bit by ...
1,168,983 views
📊 Google Data Analytics Certification 👉🏼 https://bit.ly/EzeT-GoogleCert-Esp 🧙♂️ Excel from Zero to Expert Course 👉🏼 https ...
284,997 views
In this video we take a look at the best resources to learn Data Visualization in 2025! 25% off Analyst Builder Code: ...
16,708 views
Download the free course files and follow along here: ➡️https://www.simonsezit.com/charts-and-dashboards-in-excel-demo-files ...
13,659 views