ViewTube

ViewTube
Sign inSign upSubscriptions
Filters

Upload date

Type

Duration

Sort by

Features

Reset

647 results

Youven
Create Stunning Python Animations for Research Papers | Matplotlib Complete Guide

Bring your scientific data to life with animated visualizations! Learn how to create professional animations in Python using ...

41:13
Create Stunning Python Animations for Research Papers | Matplotlib Complete Guide

0 views

5 days ago

PyPlus
How to Create an Area Plot Using Python and Matplotlib?

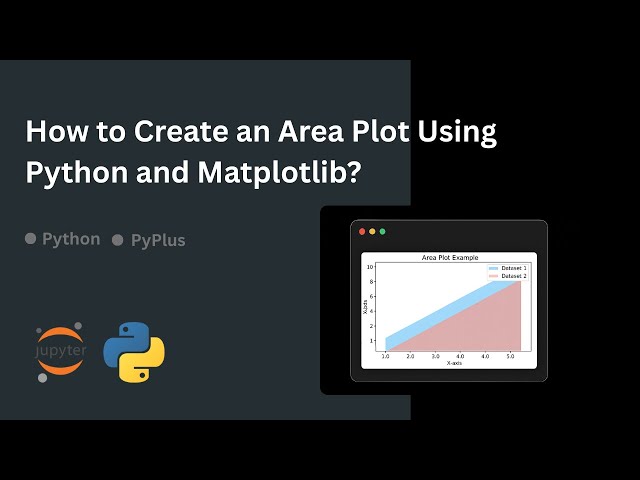
In this video, you'll learn how to create an area plot using Python with Matplotlib. Area plots are useful for visualizing trends over ...

2:17
How to Create an Area Plot Using Python and Matplotlib?

0 views

5 days ago

Youven
Matplotlib Sketch Style Plots for Research Presentation (Complete Python Guide)

Learn how to create stunning hand-drawn sketch style plots in Matplotlib that make your research figures stand out!

10:16
Matplotlib Sketch Style Plots for Research Presentation (Complete Python Guide)

0 views

5 days ago

PyPlus
How to Visualize Programming Language Trends Using Python (2014–2024)?

In this video, you'll learn how to visualize programming language popularity trends using Python and Matplotlib. We plot ranking ...

6:05
How to Visualize Programming Language Trends Using Python (2014–2024)?

0 views

7 days ago

AI Evolutionary
How to Create a Filled Square Pattern in Python Using Matplotlib

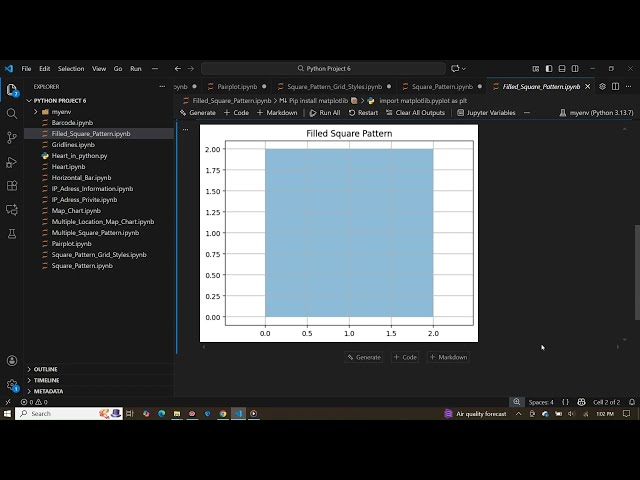
How to Create a Filled Square Pattern in Python Using Matplotlib In this video, you will learn how to create a filled square pattern ...

1:01
How to Create a Filled Square Pattern in Python Using Matplotlib

28 views

7 days ago

GuideRealm
How To Install Python Libraries In Visual Studio Code - Step By Step

Learn how to install python libraries in visual studio code in this video. For more videos like this then please leave a like.

1:23
How To Install Python Libraries In Visual Studio Code - Step By Step

1,018 views

6 days ago

PyPlus
How to Create Streamgraphs Using Python and Matplotlib?

In this video, you'll learn how to create streamgraphs using Python with Matplotlib. Streamgraphs are a beautiful variation of ...

2:36
How to Create Streamgraphs Using Python and Matplotlib?

0 views

4 days ago

GeoHoosh
w01-6  Matplotlib

In this final video of Week 01, we introduce Matplotlib, the core Python library for data visualization and scientific plotting.

51:52
w01-6 Matplotlib

0 views

6 days ago

AI Evolutionary
Create a Horizontal Bar Chart with Labels in Python | Matplotlib Tutorial

Create a Horizontal Bar Chart with Labels in Python | Matplotlib Tutorial In this video, you will learn how to create a horizontal bar ...

0:52
Create a Horizontal Bar Chart with Labels in Python | Matplotlib Tutorial

32 views

5 days ago

Python Tyro
Line Chart, Bar Chart & Histogram in 12 Minutes | Class 12 IP | Plotting Data Using Matplotlib

Online CBSE Tuition & Doubt Clarification Sessions for Class 11 & 12 – Computer Science & Informatics Practices Contact: ...

15:08
Line Chart, Bar Chart & Histogram in 12 Minutes | Class 12 IP | Plotting Data Using Matplotlib

44 views

7 days ago

Velentena teach
Visualizing Linear Regression on Randomly Generated Data Using Python #machinelearning #Ai

In this video, we build and understand a Linear Regression model step by step using Python. We generate sample data, train a ...

20:39
Visualizing Linear Regression on Randomly Generated Data Using Python #machinelearning #Ai

20 views

7 days ago

Corporate Connexion
Matplotlib Hands-On Coding Workshop | Master Data Visualization in 1 Hour!

Welcome to the Matplotlib Hands-On Coding Workshop! In this session, we will learn data visualization from scratch using Python ...

13:55
Matplotlib Hands-On Coding Workshop | Master Data Visualization in 1 Hour!

16 views

3 days ago

Corporate Connexion
Introduction to Data Visualization with Matplotlib | Python Beginner’s Guide

FREE EXCLUSIVE WORKSHOP ALERT! CLICK HERE TO JOIN THE MEETING FOR FREE: ...

10:05
Introduction to Data Visualization with Matplotlib | Python Beginner’s Guide

54 views

3 days ago

Robo CAD
Data Cleaning & Analysis Project in Python | Pandas, Matplotlib, Seaborn Tutorial

In this tutorial, we walk you step by step through data cleaning and analysis of an e-commerce sales dataset using Python.

20:12
Data Cleaning & Analysis Project in Python | Pandas, Matplotlib, Seaborn Tutorial

0 views

10 hours ago

omgod
Task 3: Exploratory Data Analysis (EDA) using Python | Beginner Project

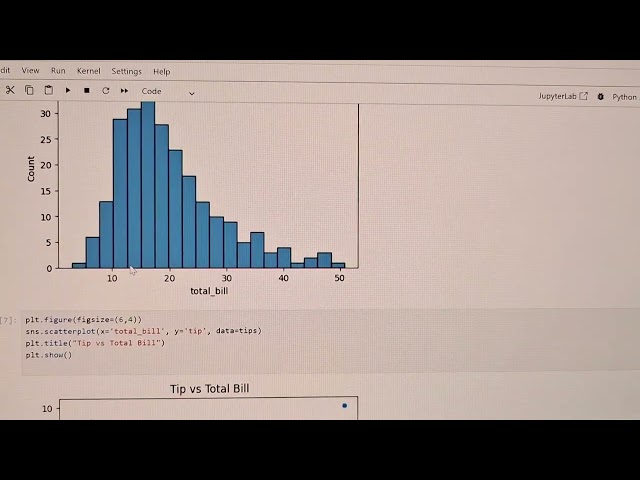
This video shows Exploratory Data Analysis using Python, Pandas, Matplotlib, and Seaborn. #internship #python Exploratory Data ...

0:53
Task 3: Exploratory Data Analysis (EDA) using Python | Beginner Project

0 views

5 days ago

omgod
Task 4 Data Visualization @TechnoHacks @SandipGavit

Task 4 – Data Visualization | TechnoHacks Internship In this video, I have performed Data Visualization using Python.

0:51
Task 4 Data Visualization @TechnoHacks @SandipGavit

5 views

6 days ago

MachineLearnAthon
Tutorial on Data preparation and visualization

Get started with data analysis in Python using Jupyter Notebook! This tutorial introduces essential libraries — NumPy, pandas, ...

11:25
Tutorial on Data preparation and visualization

0 views

5 days ago

Corporate Connexion
Master Every Plot Type in Matplotlib | Complete Data Visualization Guide for Beginners

Data visualization is one of the most important skills in Data Science, Machine Learning, and Analytics. In this video, you will ...

8:43
Master Every Plot Type in Matplotlib | Complete Data Visualization Guide for Beginners

0 views

7 hours ago