Upload date
All time
Last hour
Today
This week
This month
This year
Type
All
Video
Channel
Playlist
Movie
Duration
Short (< 4 minutes)
Medium (4-20 minutes)
Long (> 20 minutes)
Sort by
Relevance
Rating
View count
Features
HD
Subtitles/CC
Creative Commons
3D
Live
4K
360°
VR180
HDR
178 results
392 views
11 years ago
BIDS Data Science Lecture Series | September 4, 2015 | 1:00-2:30 p.m. | 190 Doe Library, UC Berkeley Speaker: Nathaniel Smith, ...
1,941 views
Streamed 10 years ago
If I want to set the axes endpoints I can but pyplot will do that for me automatically and hopefully it will do a good job. Usually what ...
1,227 views
7 years ago
Seaborn is a great plotting package for Data Science in Python. It allows you to easily generate common kinds of plots that help ...
796 views
4 years ago
Online CBSE Tuition & Doubt Clarification Sessions for Class 11 & 12 – Computer Science & IP. Contact: ...
5,051 views
1 year ago
This Python 3 tutorial course aims to teach everyone the basics of programming computers using Python. The course has no ...
7,582,121 views
6 years ago
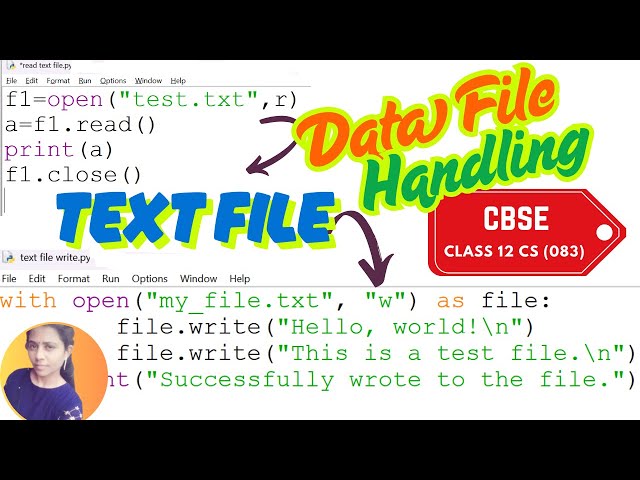
Online CBSE Tuition Available for Class 11 & 12 – Computer Science & IP. Contact: pythontyro0341@gmail.com | WhatsApp: ...
4,553 views
Python is a high-level programming language that is leveraged in a wide range of disciplines and fields. This webinar training ...
140 views
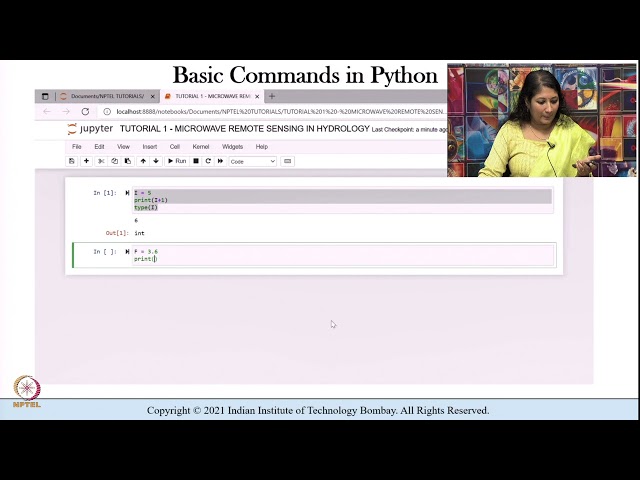
Week 1: Tutorial 01: Python Programming From Beginner Perspective.
3,041 views
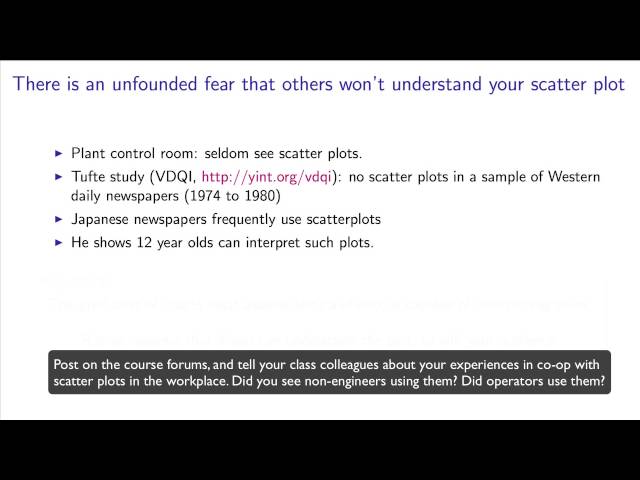
These videos are part of the FREE online book, "Process Improvement using Data", http://yint.org/pid Related is the Coursera ...
3,685 views
Data science sits at the intersection of coding, math/statistics, and applied domain knowledge. This video explores those ...
9,462 views
9 years ago
In this video, I will show you how to add new information to pandas DataFrames by processing the existing data. We use pandas ...
836 views
Learn Data Science is this full tutorial course for absolute beginners. Data science is considered the "sexiest job of the 21st ...
4,338,765 views
Creating a Pie subclass for our Bakery Class. View an annotated PDF transcription of the video: ...
515 views
Welcome to 'Introduction to Learning Analytics' course ! This video examines different chart types and their effectiveness in ...
2,708 views
Patrick Osborne (@patrick_osborne), VP and GM of Big Data & secondary storage joins CUBE host Dave Vellante (@dvellante)
287 views
Using https://infranodus.com you can import your ChatGPT conversations and visualize the main topics as a knowledge graph ...
15,453 views
2 years ago
... to an actual answer a related question is when does this work so this is one way to solve that right we just asked numpy to solve ...
180 views
5 years ago
Learn about the Data Science Pipeline with the National Student Data Corps! The fifth step in the Data Science Pipeline is Data ...
221 views
Tutorial Lab. Programowanie komputerów Python 3.8 W tym kursie znajdziesz szczegółowe informacje na temat: ⭐ Obsługa ...
322 views