Upload date
All time
Last hour
Today
This week
This month
This year
Type
All
Video
Channel
Playlist
Movie
Duration
Short (< 4 minutes)
Medium (4-20 minutes)
Long (> 20 minutes)
Sort by
Relevance
Rating
View count
Features
HD
Subtitles/CC
Creative Commons
3D
Live
4K
360°
VR180
HDR
17 results
Matplotlib is Python's most powerful data visualization library — and most tutorials only scratch the surface. This crash course ...
2 views
1 hour ago
import matplotlib.pyplot as plt → Imports Matplotlib plotting module. plt.plot(x, y) → Draws a line graph. plt.title() → Adds a graph ...
9 views
1 day ago
Adding text into bar-chart graph in Matplotlib (Python) Helpful? Please use the *Thanks* button above! Or, thank me via Patreon: ...
8 views
5 days ago
... इन Python के अंदर यहां पर हमारा प्रोग्राम है और यहां हमारा इसका आउटपुट ...
3 views
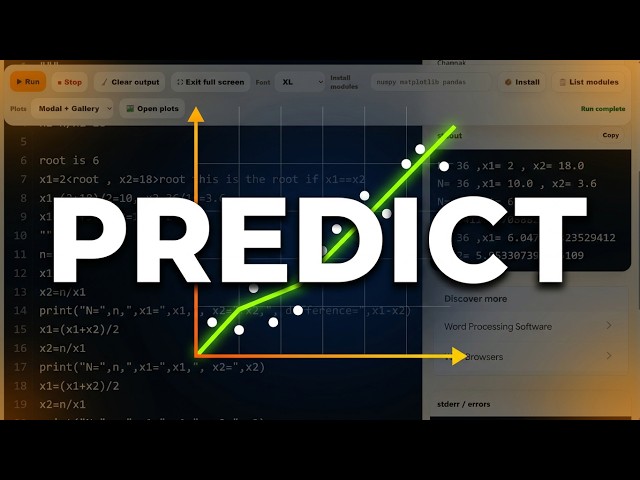
This is the 4th and last video in our preparation series before starting Machine Learning programming. Before we begin Machine ...
47 views
3 days ago
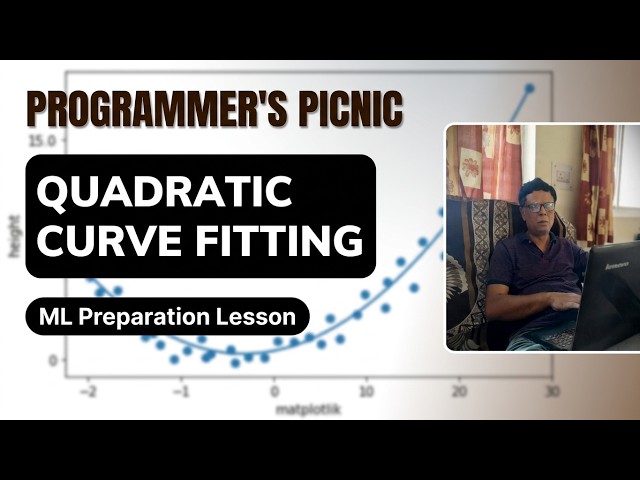
Starting Machine Learning programming. Learning Machine Learning, we must understand how data points can be used for ...
92 views
Description: This is the 4th and final video in our preparation series before starting Machine Learning programming. Before ...
131 views
6 days ago
38 views
Separate two groups of bars in matplotlib Helpful? Please use the *Thanks* button above! Or, thank me via Patreon: ...
1 view
2 days ago
Mathjax/Matplotlib font in Jupyter Helpful? Please use the *Thanks* button above! Or, thank me via Patreon: ...
26 views
Python : How to export a contourf to a 2D array? Helpful? Please use the *Thanks* button above! Or, thank me via Patreon: ...
5 views
Embedding pyplot graph into html on django framework Helpful? Please use the *Thanks* button above! Or, thank me via ...
4 days ago
Pandas Series Methods - Head() , Count() , Tail() | Data Handling using Pandas #pythontutorial #informaticspractices ...
Pandas Series Attributes - name , index.name , values , size , empty | Data Handling using Pandas #pythontutorial ...
4 views
2D Histogram normalized for probabilities Helpful? Please use the *Thanks* button above! Or, thank me via Patreon: ...
The Bars of my Histogram are not showing and are cut off Helpful? Please use the *Thanks* button above! Or, thank me via ...
12 views
Plot bar graph using the first column as x axe Helpful? Please use the *Thanks* button above! Or, thank me via Patreon: ...