ViewTube

ViewTube
Sign inSign upSubscriptions
Filters

Upload date

Type

Duration

Sort by

Features

Reset

37 results

Youven
Make Your Matplotlib Figures Publication Quality (Step-by-Step)

Create publication-ready scientific figures with Matplotlib! This comprehensive step-by-step tutorial teaches you everything ...

32:06
Make Your Matplotlib Figures Publication Quality (Step-by-Step)

0 views

11 hours ago

School of Programming and Software Development
Master Data Visualization in Python with Matplotlib (Beginner Friendly) - (Week 6 - Lesson 2)

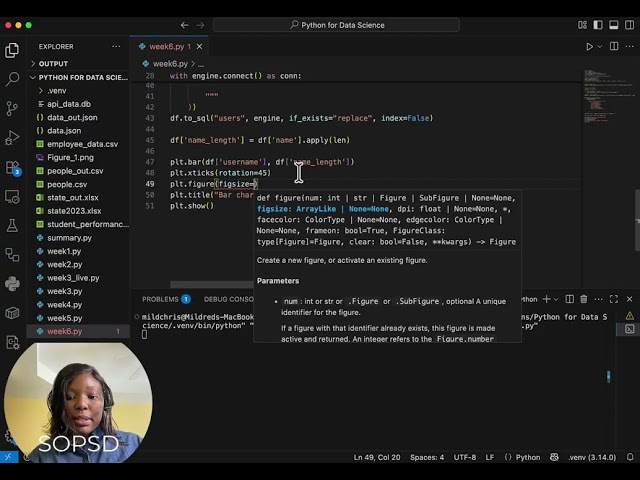
School of Programming and Software Development sop-AI-101: Python for Data Science This lesson introduces students to ...

16:23
Master Data Visualization in Python with Matplotlib (Beginner Friendly) - (Week 6 - Lesson 2)

11 views

22 hours ago

Data Coaching
Clean Messy Data FAST with Power Query

Free Data Analyst KickStarter Pack - https://datacoaching4628.graphy.com/courses/dataanalyst-freecourse Check Data Analytics ...

23:29
Clean Messy Data FAST with Power Query

61 views

7 hours ago

Datum Decode
Advanced Data Cleaning Project in Python Netflix Kaggle Dataset  Real World Data Science Case Study

In this video, we perform extremely advanced level data cleaning on the popular Netflix Kaggle dataset using Python. This is NOT ...

13:34
Advanced Data Cleaning Project in Python Netflix Kaggle Dataset Real World Data Science Case Study

0 views

9 hours ago

School of Programming and Software Development
Matplotlib Is Not Enough — Make Beautiful Visuals with Seaborn + Plotly (Week 6  -   Lesson 3)

School of Programming and Software Development sop-AI-101: Python for Data Science This lesson shows students how to ...

12:37
Matplotlib Is Not Enough — Make Beautiful Visuals with Seaborn + Plotly (Week 6 - Lesson 3)

8 views

22 hours ago

TechHub
House Price Prediction using Linear Regression | Python Machine Learning Project

Project Title: House Price Prediction using Linear Regression This project is a Machine Learning based system that predicts ...

2:43
House Price Prediction using Linear Regression | Python Machine Learning Project

0 views

23 hours ago

CA Wajahat
Python for Finance Tutorial for Beginners | Class 1: Introduction

Is Python really the "secret sauce" of Wall Street? Welcome to Class 1 of our comprehensive series on Python for Modern Finance!

5:11
Python for Finance Tutorial for Beginners | Class 1: Introduction

8 views

23 hours ago

AI School of India
తెలుగులో End to End Data Analytics Real-time Project | Python + Pandas + Visualization | by Sangeeth

End-to-End Data Analytics Project in Telugu – In this video, I built a complete real-world Data Analytics Project using Python, ...

1:16:47
తెలుగులో End to End Data Analytics Real-time Project | Python + Pandas + Visualization | by Sangeeth

364 views

22 hours ago

Channel 73
Solving 10 Million Sudoku puzzles using Python, PIL and OpenCV : Part 125

Sudoku is a common number puzzle, that can be seen in newspapers, and online portals. It is a 9 x 9 grid, and the idea is to fill ...

11:07:06
Solving 10 Million Sudoku puzzles using Python, PIL and OpenCV : Part 125

0 views

1 day ago

Programming Ocean Academy
الجزء الرابع- التمثيلات البيانية للبيانات باستخدام مكتبة ماتبلوت ليب-MatPlotLib

في هذا الفيديو نقدم شرحًا عمليًا ومركّزًا لمكتبة Matplotlib، الأداة الأساسية لتصوير البيانات باستخدام Python. خلال هذا الدرس ستتعرّف ...

1:34:45
الجزء الرابع- التمثيلات البيانية للبيانات باستخدام مكتبة ماتبلوت ليب-MatPlotLib

41 views

22 hours ago

Channel 73
Solving 10 Million Sudoku puzzles using Python, PIL and OpenCV : Part 126

Sudoku is a common number puzzle, that can be seen in newspapers, and online portals. It is a 9 x 9 grid, and the idea is to fill ...

11:07:06
Solving 10 Million Sudoku puzzles using Python, PIL and OpenCV : Part 126

0 views

11 minutes ago

大豆說球
【中文翻譯】Corbin Carroll 受傷退出 WBC!#MLBTonight 解析對 2026 賽季的衝擊

Corbin Carroll 在春訓傳出受傷消息,確定將退出 2026 年世界棒球經典賽 (WBC)。 #MLBTonight 團隊針對此事件進行深入分析, ...

1:34
【中文翻譯】Corbin Carroll 受傷退出 WBC!#MLBTonight 解析對 2026 賽季的衝擊

531 views

16 hours ago

Dive in Data
SQL- Orders Having More Than 2 Distinct Products | Top 75 SQL Coding Interview Questions

Here you will learn the new-edge technologies like Data Science, Machine Learning, SQL, Python, Power BI, Tableau, and other ...

9:13
SQL- Orders Having More Than 2 Distinct Products | Top 75 SQL Coding Interview Questions

9 views

1 hour ago

CV orbit
Grocery Item Detection using SSD (PyTorch) | Train Custom Object Detector from Scratch

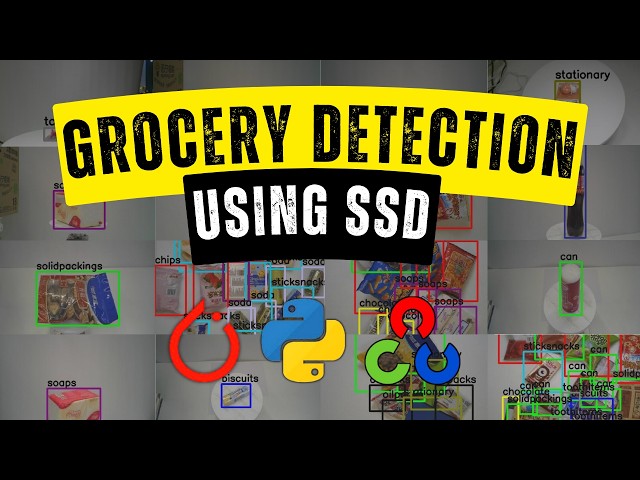
Grocery Items Object Detection using SSD (PyTorch) | End-to-End Training Tutorial In this video, we build a Grocery Product ...

37:17
Grocery Item Detection using SSD (PyTorch) | Train Custom Object Detector from Scratch

0 views

3 hours ago

Ai Codes Institute
AI Consultation Session 1

Join our hands-on Artificial Intelligence Course at AI Codes Institute — designed for beginners, students, and anyone who wants ...

1:04:25
AI Consultation Session 1

40 views

Streamed 1 day ago

NFC Market Live
AIが全力で運営する経済放送局「NFC Market Live」 | 24時間 日米経済指標&国債金利速報

【コンセプト】 「感情を持たないAIが、淡々と事実(データ)だけを伝え続ける」 24時間365日、世界の金融市場を定点観測する ...

Live
AIが全力で運営する経済放送局「NFC Market Live」 | 24時間 日米経済指標&国債金利速報

0 views

0

Sir Bolankhan
Styling & Customization in Matplotlib | Beautiful Charts | Data Analyst | Hindi/Urdu

Is video mein hum Matplotlib Styling aur Customization ko detail mein cover karenge jisse aap apne Python charts aur graphs ko ...

20:49
Styling & Customization in Matplotlib | Beautiful Charts | Data Analyst | Hindi/Urdu

0 views

2 hours ago

Hafiz Muhammad Naveed
Track Stock Levels & Reorders Using Python(pandas,numpy,matplotlib)

In this video, we build a smart inventory management system step by step. You'll learn how to monitor product stock levels ...

13:41
Track Stock Levels & Reorders Using Python(pandas,numpy,matplotlib)

0 views

5 hours ago

APOLLO COMPUTER EDUCATION SRIVILLIPUTTUR
“High Salary IT Job-க்கு முதல் Step – Data Science” Course 📊📊🏸

Data Science Course – Key Details (Sample) Course Name: Data Science & Machine Learning Duration: 4–6 Months Mode: ...

3:26
“High Salary IT Job-க்கு முதல் Step – Data Science” Course 📊📊🏸

0 views

11 minutes ago

Perpetua Ona
Plotting your data (Visualization) (Module 8 Video 11)

This video introduces data visualization in Python, showing how to plot your data for better insights. You'll learn how to create ...

14:47
Plotting your data (Visualization) (Module 8 Video 11)

2 views

9 hours ago