ViewTube

ViewTube
Sign inSign upSubscriptions
Filters

Upload date

Type

Duration

Sort by

Features

Reset

141 results

Youven
Matplotlib Animation Tutorial: Visualize Scientific Data Like a Pro

Bring your scientific data to life with animated visualizations! Learn how to create professional animations in Python using ...

41:13
Matplotlib Animation Tutorial: Visualize Scientific Data Like a Pro

0 views

12 days ago

Digital Yash
AI Decision Surface in motion  Python + Matplotlib =Visual magic🔥#Python#Matplotlib#AIVisualization

Animated 3D Surface Visualization using Python & Matplotlib This video demonstrates a rotating and animated 3D surface ...

0:21
AI Decision Surface in motion Python + Matplotlib =Visual magic🔥#Python#Matplotlib#AIVisualization

0 views

7 days ago

DeepVision
python animation

This Python code creates a simple animation using matplotlib by updating the graph frame by frame.

0:08
python animation

41 views

2 weeks ago

jaketrobert1000
Cool slinky animation #python #matplotlib #mathart
0:09
Cool slinky animation #python #matplotlib #mathart

80 views

2 weeks ago

Help To Achieve
Lottie-style visualization of Bubble sort Algorithm using Python.

Watch how the Bubble Sort algorithm organizes data in real-time using Lottie-style loading animation using pure Python. How it ...

0:27
Lottie-style visualization of Bubble sort Algorithm using Python.

1,648 views

5 days ago

Milan's Data Stories
Web Mercator vs True Size: Country Shape Animation in Python | #30DayMapChallenge (19/30)

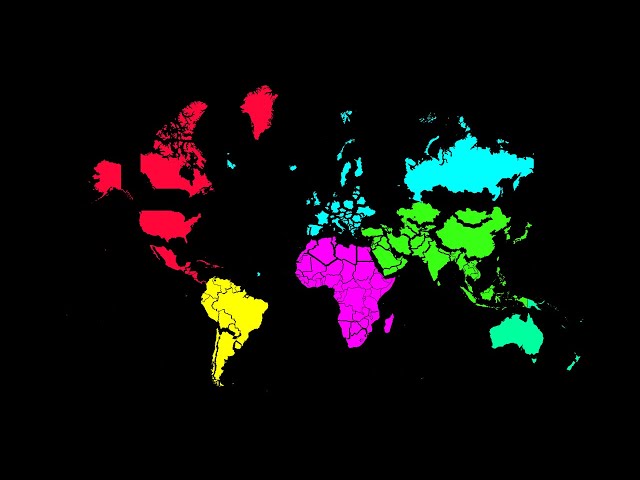
I always adored visualizations comparing various projections vs the true size of the countries, and I have been planning to create ...

13:43
Web Mercator vs True Size: Country Shape Animation in Python | #30DayMapChallenge (19/30)

99 views

6 days ago

J.
Attempt to Recreate Hoppensteadt's Bifurcation Visualization - Logistic Map Animation in matplotlib

The logistic map equation: x(n+1) = r·x(n)·(1-x(n)). As r increases, the system transitions from stable to oscillating to chaotic ...

1:05
Attempt to Recreate Hoppensteadt's Bifurcation Visualization - Logistic Map Animation in matplotlib

19 views

4 weeks ago

CalmReels
Mesmerizing Particle Network Animation | Hypnotic Visual Effects | 4K Quality

Rain by Twin Musicom is licensed under a Creative Commons Attribution 4.0 license. https://creativecommons.org/licenses/by/4.0/ ...

0:15
Mesmerizing Particle Network Animation | Hypnotic Visual Effects | 4K Quality

18 views

11 days ago

PyPlus
How to Create a Beautiful Happy New Year Animation in Python

In this video, you will learn how to create a beautiful Happy New Year animation in Python using VS Code. This animation uses ...

8:08
How to Create a Beautiful Happy New Year Animation in Python

0 views

3 days ago

Code With RTech
Insane Colorful Spirograph Animation Using Python 😱🔥 | Code With RTech #shorts

Python isn't just for coding Watch this ultra-colorful spirograph animation made entirely with Python and Matplotlib If you're ...

0:15
Insane Colorful Spirograph Animation Using Python 😱🔥 | Code With RTech #shorts

279 views

2 days ago

Digital Yash
🌀 Rotating Spiral Animation using Python#Python #Matplotlib #PythonAnimation #Coding#Tech#Math #AI

Rotating Spiral Animation using Python This beautiful spiral animation is created using Python and Matplotlib. It shows how math ...

0:32
🌀 Rotating Spiral Animation using Python#Python #Matplotlib #PythonAnimation #Coding#Tech#Math #AI

178 views

8 days ago

PYAI HUB
Animated Simple Solar System in Python (Matplotlib) | Blazing Space Visualization 🚀

Thanks for watching! Here's the full code and project files: ...

2:38
Animated Simple Solar System in Python (Matplotlib) | Blazing Space Visualization 🚀

64 views

3 weeks ago

MahakBCA
✨Aesthetic Space 🌀Animation⚡#Python #GalaxyAnimation #SpaceFX #Matplotlib #AestheticShorts
0:34
✨Aesthetic Space 🌀Animation⚡#Python #GalaxyAnimation #SpaceFX #Matplotlib #AestheticShorts

156 views

3 weeks ago

MITINDIA
India Population Growth (1905–2025) | Animated Area Chart in Crores

This video shows the population growth of India from 1905 to 2025 using a smooth animated area chart. Population values are ...

0:13
India Population Growth (1905–2025) | Animated Area Chart in Crores

65 views

2 weeks ago

BuildWithCode
"3D Function Visualization in Python"

This project demonstrates 3D mathematical visualization using Python and Matplotlib. By plotting the function sin(√x² + y²), ...

0:35
"3D Function Visualization in Python"

115 views

11 days ago

Crack Trifac
🌀 Rotating Text #css #html #javascript #js #webdevelopment #animation #text #tips #tricks #coding

Master the Art of Rotating Text with CSS, HTML & JavaScript! In this game-changing tutorial, we dive into the world of web ...

0:05
🌀 Rotating Text #css #html #javascript #js #webdevelopment #animation #text #tips #tricks #coding

1,731 views

3 weeks ago

Aero Static
Pi Graphed

Pi if it were plotted points on a chart by 2 rotating lines. Pretty common thing, but I just learned how MatPlotLib (what you use to ...

0:48
Pi Graphed

23 views

1 month ago

Anar STEM Animations
When Math Becomes Art: A 3D Torus Knot Tube

3D Rainbow Cinquefoil Torus Knot | Parametric Geometry in Motion Watch mathematics come alive in this mesmerizing 3D ...

0:05
When Math Becomes Art: A 3D Torus Knot Tube

2,112 views

13 days ago

Digital Yash
AI Brain Pulse Animation#AI #Python #ArtificialIntelligence#MachineLearning #DataScience#TechYouTube

This AI Brain Pulse Animation visually represents how an artificial brain processes signals and learns patterns. Built using: ...

0:05
AI Brain Pulse Animation#AI #Python #ArtificialIntelligence#MachineLearning #DataScience#TechYouTube

267 views

6 days ago

TechLogy
Beautiful Geometric Animation in Python | Stunning Visuals with Code

In this video i have used python with matplotlib and numpy library to illustrate beautiful geometric animation. #python #panda ...

1:36
Beautiful Geometric Animation in Python | Stunning Visuals with Code

0 views

13 days ago