ViewTube

ViewTube
Sign inSign upSubscriptions
Filters

Upload date

Type

Duration

Sort by

Features

Reset

574 results

Youven
Create Stunning Python Animations for Research Papers | Matplotlib Complete Guide

Bring your scientific data to life with animated visualizations! Learn how to create professional animations in Python using ...

41:13
Create Stunning Python Animations for Research Papers | Matplotlib Complete Guide

0 views

6 days ago

PyPlus
How to Create an Area Plot Using Python and Matplotlib?

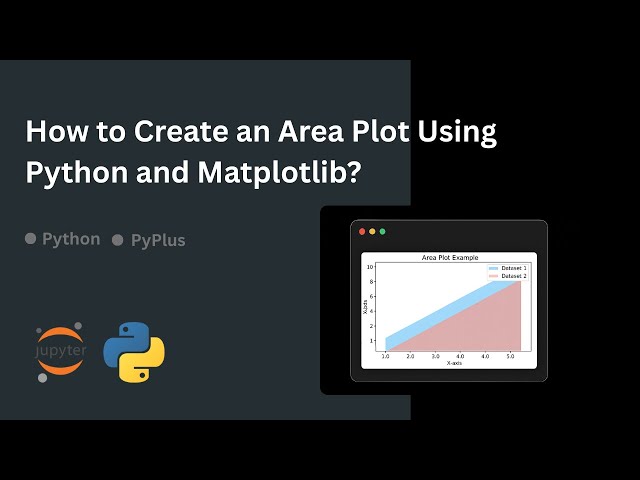
In this video, you'll learn how to create an area plot using Python with Matplotlib. Area plots are useful for visualizing trends over ...

2:17
How to Create an Area Plot Using Python and Matplotlib?

0 views

6 days ago

Simplilearn
🔥Python for Data Science Roadmap  Step-by-Step Guide for 2026 #shorts #simplilearn

In this short, you'll get a clear Python for Data Science roadmap to help you stay ahead in 2026. We walk through the complete ...

1:13
🔥Python for Data Science Roadmap Step-by-Step Guide for 2026 #shorts #simplilearn

4,135 views

1 day ago

Youven
Sketch Style Plots With Matplolib and Python (one line change)

Learn how to create stunning hand-drawn sketch style plots in Matplotlib that make your research figures stand out!

10:16
Sketch Style Plots With Matplolib and Python (one line change)

0 views

6 days ago

Robo CAD
Data Cleaning & Analysis Project in Python | Pandas, Matplotlib, Seaborn Tutorial

In this tutorial, we walk you step by step through data cleaning and analysis of an e-commerce sales dataset using Python.

20:12
Data Cleaning & Analysis Project in Python | Pandas, Matplotlib, Seaborn Tutorial

29 views

1 day ago

PyPlus
How to Create Streamgraphs Using Python and Matplotlib?

In this video, you'll learn how to create streamgraphs using Python with Matplotlib. Streamgraphs are a beautiful variation of ...

2:36
How to Create Streamgraphs Using Python and Matplotlib?

0 views

5 days ago

CodewithPrashant
Python Data Visualization Tools

Top Python Data Visualization Tools You Should Know Turn raw data into powerful insights with Python's most popular ...

0:07
Python Data Visualization Tools

5,397 views

5 days ago

Corporate Connexion
Introduction to Data Visualization with Matplotlib | Python Beginner’s Guide

FREE EXCLUSIVE WORKSHOP ALERT! CLICK HERE TO JOIN THE MEETING FOR FREE: ...

10:05
Introduction to Data Visualization with Matplotlib | Python Beginner’s Guide

54 views

4 days ago

Wano Coder
Multiple Bar Graph in Python 📊 | Data Visualization for Beginners

In this short, I demonstrate how to create a multiple bar graph in Python using Matplotlib. This type of bar chart is commonly used ...

0:37
Multiple Bar Graph in Python 📊 | Data Visualization for Beginners

1,555 views

5 days ago

AI Evolutionary
Create a Horizontal Bar Chart with Labels in Python | Matplotlib Tutorial

Create a Horizontal Bar Chart with Labels in Python | Matplotlib Tutorial In this video, you will learn how to create a horizontal bar ...

0:52
Create a Horizontal Bar Chart with Labels in Python | Matplotlib Tutorial

32 views

6 days ago

Corporate Connexion
Matplotlib Hands-On Coding Workshop | Master Data Visualization in 1 Hour!

Welcome to the Matplotlib Hands-On Coding Workshop! In this session, we will learn data visualization from scratch using Python ...

13:55
Matplotlib Hands-On Coding Workshop | Master Data Visualization in 1 Hour!

16 views

4 days ago

Digital Yash
AI Decision Surface in motion  Python + Matplotlib =Visual magic🔥#Python#Matplotlib#AIVisualization

Animated 3D Surface Visualization using Python & Matplotlib This video demonstrates a rotating and animated 3D surface ...

0:21
AI Decision Surface in motion Python + Matplotlib =Visual magic🔥#Python#Matplotlib#AIVisualization

0 views

2 days ago

Eldar Mammadov Ilham
F1 Not Finished Races Analysis | Python Data Visualization with Pandas & Matplotlib #f1

In this Python data visualization tutorial, we analyze Formula 1 not finished races using pandas and matplotlib. What you'll ...

0:56
F1 Not Finished Races Analysis | Python Data Visualization with Pandas & Matplotlib #f1

0 views

6 days ago

BuildWithCode
"3D Function Visualization in Python"

This project demonstrates 3D mathematical visualization using Python and Matplotlib. By plotting the function sin(√x² + y²), ...

0:35
"3D Function Visualization in Python"

113 views

5 days ago

Dive in Data
STOP Writing Long Code! ❌ Use This Instead #programminglanguage #python #coding #dataanalysis

Here you will learn the new-edge technologies like Data Science, Machine Learning, SQL, Python, Power BI, Tableau, and other ...

2:54
STOP Writing Long Code! ❌ Use This Instead #programminglanguage #python #coding #dataanalysis

905 views

6 days ago

Only Python
Core Python

Welcome to our Python learning channel! Here, you'll find easy-to-understand tutorials, coding challenges, and tips to enhance ...

0:16
Core Python

0 views

5 days ago

MachineLearnAthon
Tutorial on Data preparation and visualization

Get started with data analysis in Python using Jupyter Notebook! This tutorial introduces essential libraries — NumPy, pandas, ...

11:25
Tutorial on Data preparation and visualization

0 views

6 days ago

Corporate Connexion
Master Every Plot Type in Matplotlib | Complete Data Visualization Guide for Beginners

Data visualization is one of the most important skills in Data Science, Machine Learning, and Analytics. In this video, you will ...

8:43
Master Every Plot Type in Matplotlib | Complete Data Visualization Guide for Beginners

24 views

1 day ago

omgod
Task 3: Exploratory Data Analysis (EDA) using Python | Beginner Project

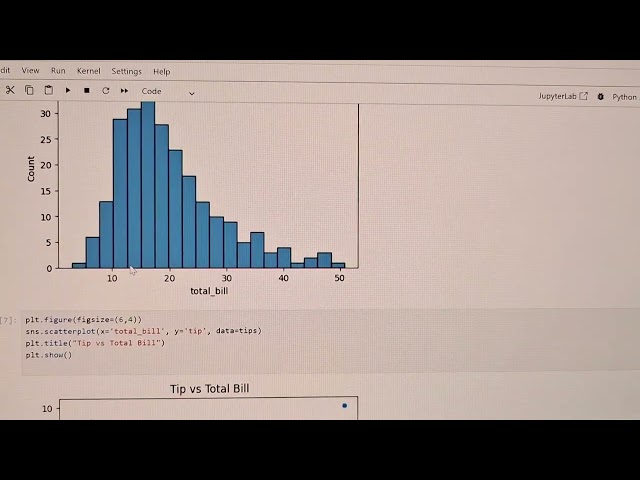
This video shows Exploratory Data Analysis using Python, Pandas, Matplotlib, and Seaborn. #internship #python Exploratory Data ...

0:53
Task 3: Exploratory Data Analysis (EDA) using Python | Beginner Project

0 views

6 days ago

Mathew K Analytics
06 Visualize KPI Dashboard: Survival Rate by Passenger Class with Pandas and Matplotlib

Learn how to visualize key performance indicators (KPIs) in Python using Pandas and Matplotlib. In this lesson, we demonstrate ...

1:21
06 Visualize KPI Dashboard: Survival Rate by Passenger Class with Pandas and Matplotlib

0 views

18 hours ago