Upload date
All time
Last hour
Today
This week
This month
This year
Type
All
Video
Channel
Playlist
Movie
Duration
Short (< 4 minutes)
Medium (4-20 minutes)
Long (> 20 minutes)
Sort by
Relevance
Rating
View count
Features
HD
Subtitles/CC
Creative Commons
3D
Live
4K
360°
VR180
HDR
2,851 results
To learn for free on Brilliant, go to https://brilliant.org/techwithtim . Brilliant's also given our viewers 20% off an annual Premium ...
9,093 views
2 weeks ago
Matplotlib Python Tutorial for Beginners | Data Visualization in Python Matplotlib is a python library used for data ...
8,447 views
Visualizing data helps you understand it faster, and Matplotlib is one of the best Python tools for making charts. In this video, Lead ...
1,484 views
8 days ago
This video shows how to install matplotlib on Python 3.14.3 It will walk you through, step-by-step, how to install matplotlib on ...
19 views
AI, ML & Python — Job Ready Course ...
236 views
In Part 1 of this Data Visualization with Python Course 2026, you will get a complete introduction to Matplotlib, Seaborn, and Plotly ...
146 views
6 days ago
What is a stacked area plot and how can you create one using Python? In this video, you'll learn how to visualize multiple ...
1 view
Master Data Visualization with Python's Most Powerful Library! Perfect for students, beginners, and aspiring data scientists.
45 views
In this video, I'll show you how to use the yfinance library to fetch real-time stock data, analyze price trends, and even visualize ...
201 views
5 days ago
00:00 Welcome, and hunkering 01:42 We're talking about primes 07:00 Let's code! Our first prime finding algorithm 22:42 Modular ...
965 views
Streamed 2 weeks ago
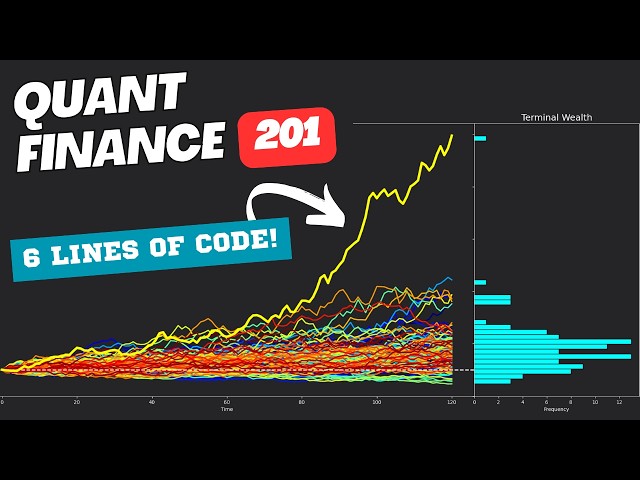
The second video in a Python, NumPy, Pandas, and Matplotlib based based computational / quant finance series, spanning from ...
4,371 views
3 weeks ago
2 views
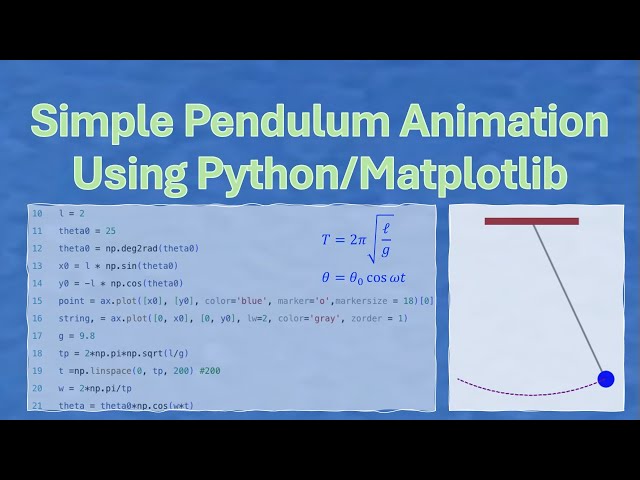
In this video, you will learn how to write a python program to do the animation of a simple pendulum. Step by step instructions are ...
18 views
4 weeks ago
What happens when circular waves overlap? In this video, you'll see how to visualize circular wave superposition using Python ...
0 views
CSV Data can be found here: https://catalog.data.gov/dataset/electric-vehicle-population-data.
42 views
In Python Episode #3, we move beyond basic syntax and start working with real data using the tools professionals rely on every ...
35 views
DataVisualization #PythonDataVisualization #Python #Matplotlib #Seaborn #Pandas #NumPy #DataScience #DataAnalysis ...
1,865 views
12 days ago
Register here: Here's the link- https://bit.ly/DataAnalytics-Data Data Analytics Roadmap for 2026 | Complete Step-by-Step ...
3,088 views
In this tutorial, we explore how to visualize geospatial data in Python without using Folium — a common challenge for GIS ...
10 days ago
4 views


![Data Visualization with Python Course [2026] - Part 1: Introduction to Matplotlib, Seaborn & Plotly](/api/proxy/image?url=https%3A%2F%2Fi.ytimg.com%2Fvi%2FaW6MmqjY0S4%2Fsddefault.jpg)