ViewTube

ViewTube
Sign inSign upSubscriptions
Filters

Upload date

Type

Duration

Sort by

Features

Reset

2,750 results

Mi camino Quant
Matplotlib y Plotly en Python: Gráficas Financieras desde Cero | Mi Camino Quant

Una imagen vale más que 1000 filas de datos. En análisis cuantitativo visualizar bien es tan importante como calcular bien.

14:38
Matplotlib y Plotly en Python: Gráficas Financieras desde Cero | Mi Camino Quant

26 views

2 weeks ago

code io - Tamil
Matplotlib Full Course in 90 Minutes  | Python for AI DS - part 3 | code io - Tamil

Link to download Anaconda : https://www.anaconda.com/products/navigator Google Colab : https://colab.research.google.com/ ...

1:31:56
Matplotlib Full Course in 90 Minutes | Python for AI DS - part 3 | code io - Tamil

1,339 views

2 weeks ago

code io - Tamil
Introduction to Matplotlib | Ep-1 Matplotlib | Python for AI DS | code io - Tamil

Actual Video starts at : 3:03 Google Colab : https://colab.research.google.com/ Follow us on Instagram code io ...

14:10
Introduction to Matplotlib | Ep-1 Matplotlib | Python for AI DS | code io - Tamil

1,071 views

4 weeks ago

Jakubication
How To Install matplotlib in Python 3.14.5

This video shows how to install matplotlib on Python 3.14.5 It will walk you through, step-by-step, how to install matplotlib on ...

2:24
How To Install matplotlib in Python 3.14.5

60 views

3 weeks ago

AI Evolutionary
Python Line Plot Tutorial for Beginners | Matplotlib Step by Step Guide

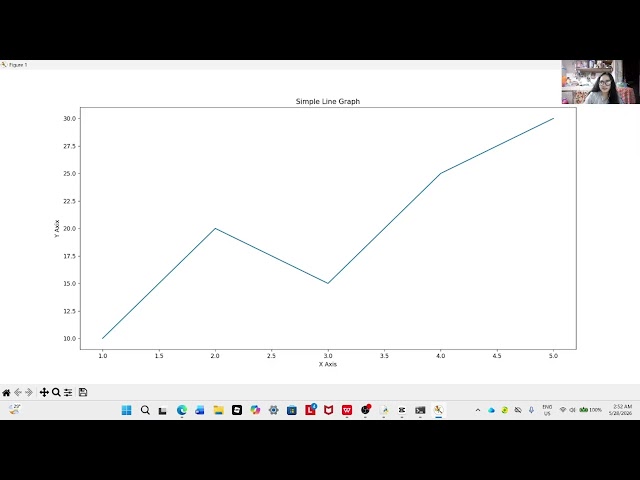
Python Line Plot Tutorial for Beginners | Matplotlib Step by Step Guide In this video, you will learn how to create a simple line chart ...

1:00
Python Line Plot Tutorial for Beginners | Matplotlib Step by Step Guide

16 views

3 weeks ago

Elhaine Daniel
Exploring the Basics of MatPlotLib Library in Python

This video talks about the Matplotlib capabilities, and applying it into a simple, working program that makes a line graph ...

11:09
Exploring the Basics of MatPlotLib Library in Python

3 views

12 days ago

Kuro
Matplotlib: Data Visualization with Python - The Grandfather of Python Plotting

Matplotlib is the grandfather of Python data visualization. Created by John D. Hunter in 2002, it powers virtually every data science ...

1:37
Matplotlib: Data Visualization with Python - The Grandfather of Python Plotting

12 views

3 weeks ago

NARVAEZ, JULIA L.
Matplotlib Tutorial for Beginners: Learn Data Visualization in Python
13:22
Matplotlib Tutorial for Beginners: Learn Data Visualization in Python

4 views

13 days ago

ALUB, SOPHIA GUADALUPE L.
MATPLOTLIB Instructional Video | Alub, Sophia Guadalupe L.

In this video, I explain: • What Matplotlib is • Creating graphs using plt.plot() • Adding titles and labels Tools Used: • Python ...

9:11
MATPLOTLIB Instructional Video | Alub, Sophia Guadalupe L.

20 views

2 weeks ago

python_coding
Python 3D Charts with Matplotlib! 📊Turning raw student data into a pro 3D chart.#Python #DataViz
0:43
Python 3D Charts with Matplotlib! 📊Turning raw student data into a pro 3D chart.#Python #DataViz

3 views

2 weeks ago

Bioalgothinkers
Python Pandas for Beginners | Data Analysis, Matplotlib & Seaborn Tutorial

In this beginner-friendly Python Pandas tutorial, you will learn how to perform real-world data analysis using Pandas, Matplotlib, ...

20:05
Python Pandas for Beginners | Data Analysis, Matplotlib & Seaborn Tutorial

19 views

3 weeks ago

AI Evolutionary
Create Beautiful Area Charts with Python & Matplotlib

Create Beautiful Area Charts with Python & Matplotlib Learn how to create a beautiful Area Chart in Python using Matplotlib!

0:50
Create Beautiful Area Charts with Python & Matplotlib

14 views

3 weeks ago

CompGBI Lab
Introduction to Python - Plotting
0:58
Introduction to Python - Plotting

5 views

2 weeks ago

Simplilearn
Applied Data Science With Python Full Course 2026 [Free] | Python For Data Science | Simplilearn

Data Scientist Masters Program (Discount - YTBE15) ...

7:36:29
Applied Data Science With Python Full Course 2026 [Free] | Python For Data Science | Simplilearn

1,343 views

Streamed 1 day ago

AI- ON Self
Python Is Not a Snake.Using Python Libraries like NumPy & Matplotlib in AI Engineering

Welcome back to AI-ON Self System channel. In this video, I share how I used Python libraries like NumPy and Matplotlib during ...

4:10
Python Is Not a Snake.Using Python Libraries like NumPy & Matplotlib in AI Engineering

18 views

4 weeks ago

Speedy Tutorials
How To Install Matplotlib on Python in Windows 11 (pip Install & Setup)

How To Install Matplotlib in Python on Windows 11 (Fix pip install & Setup Guide) If Matplotlib isn't working or won't install, ...

1:32
How To Install Matplotlib on Python in Windows 11 (pip Install & Setup)

24 views

2 weeks ago

Mathew K Analytics
Master Matplotlib: Essential Techniques for Effective Statistical Data Visualization

Unlock the power of Matplotlib with our step-by-step tutorial designed to boost your data visualization skills! Whether you're a ...

14:45
Master Matplotlib: Essential Techniques for Effective Statistical Data Visualization

26 views

2 weeks ago

AI Evolutionary
Create Stunning Pie Charts in Python 🥧 | Matplotlib Step-by-Step Tutorial

Create Stunning Pie Charts in Python | Matplotlib Step-by-Step Tutorial Learn how to create beautiful Pie Charts in Python ...

0:57
Create Stunning Pie Charts in Python 🥧 | Matplotlib Step-by-Step Tutorial

28 views

2 weeks ago

Learn Computer Science with Prof. Rashi
Visualize Satellite NDVI Data in Python with Rasterio &Matplotlib | Anaconda Setup

GIS Lab Practical 2 is here! In this video, we open a real satellite image (.tif file), read its pixel values, and render it as a ...

10:26
Visualize Satellite NDVI Data in Python with Rasterio &Matplotlib | Anaconda Setup

26 views

3 weeks ago

LetMeTeach
Matplotlib Data Visualization Python Tutorial | Data Science | LetMeTeach

Mastering data visualization is a core requirement for any engineering student, GATE DA aspirant, or aspiring data scientist.

1:27
Matplotlib Data Visualization Python Tutorial | Data Science | LetMeTeach

10 views

2 weeks ago