ViewTube

ViewTube
Sign inSign upSubscriptions
Filters

Upload date

Type

Duration

Sort by

Features

Reset

1,107 results

Learn with Arisha
How to Easily Create Multiple 2D Plots in MATLAB Using Plot Function

In this MATLAB tutorial, you will learn how to plot multiple 2D graphs using simple plot commands. This method allows you to ...

6:14
How to Easily Create Multiple 2D Plots in MATLAB Using Plot Function

320 views

9 months ago

MATLAB
How to Create a Surface Plot with MATLAB

Engineers and scientists often work with complex, multidimensional data that is difficult to interpret in raw tables. Surface plots in ...

4:35
How to Create a Surface Plot with MATLAB

1,975 views

2 months ago

Learn with Arisha
2D Mutiple Plot in MATLAB(Part-2) #education #mathematics #matlabplotting #learnmatlab #matlabplot
1:00
2D Mutiple Plot in MATLAB(Part-2) #education #mathematics #matlabplotting #learnmatlab #matlabplot

122 views

8 months ago

Learn with Arisha
2D Mutiple Plot in MATLAB (Part-1) #education #mathematics #matlabplotting #learnmatlab #matlab

... or a researcher this skill is essential for visualizing data effectively in math lab so let's get started by plotting um multiple 2D lines ...

1:01
2D Mutiple Plot in MATLAB (Part-1) #education #mathematics #matlabplotting #learnmatlab #matlab

135 views

8 months ago

Cyborg-v22
2D Plot of a Parabola in MATLAB

This MATLAB script plots a parabolic function of the form . The x-axis represents the input values, while the y-axis shows the ...

2:35
2D Plot of a Parabola in MATLAB

27 views

9 months ago

Learn with Arisha
2D Mutiple Plot in MATLAB (Part-4) #education #matlabgraphs #mathematics #matlabplotting #matlab

... of X Okay And next I'm going to plot x versus y by 3 And I'm using a color green And the style should be dash dot And I'm setting ...

1:01
2D Mutiple Plot in MATLAB (Part-4) #education #matlabgraphs #mathematics #matlabplotting #matlab

188 views

8 months ago

Cyborg-v22
2D Plot of  and  in MATLAB

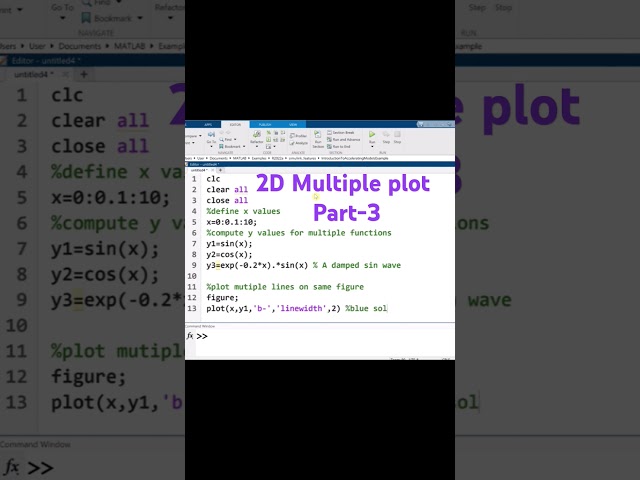
This MATLAB script generates a 2D plot of the functions and on the same axis. Different line styles and colors are used to ...

3:34
2D Plot of and in MATLAB

0 views

9 months ago

Marius
2D plots on Matlab
34:53
2D plots on Matlab

10 views

10 months ago

Learn with Arisha
2D Mutiple Plot in MATLAB (Part-5) #education #mathematics #matlabgraphs #matlabplotting #matlab

Okay so next I am going to add label title and legend because we are using we are play plotting a pre major functions so for that ...

1:01
2D Mutiple Plot in MATLAB (Part-5) #education #mathematics #matlabgraphs #matlabplotting #matlab

233 views

8 months ago

Learn with Arisha
2D Mutiple Plot in MATLAB (Part-3) #education #mathematics #matlabplotting #learnmatlab #matlab

So I am going to write figure that open a new figure window Then I'm going to plot X versus Y1 and color should be blue with style ...

1:01
2D Mutiple Plot in MATLAB (Part-3) #education #mathematics #matlabplotting #learnmatlab #matlab

103 views

8 months ago

vlogize
How to Create a 2D Plot from a NxM Matrix in MATLAB

In this guide, we will explore how to visualize a NxM matrix from sensor data in MATLAB, creating a colorful 2D plot to effectively ...

1:33
How to Create a 2D Plot from a NxM Matrix in MATLAB

10 views

7 months ago

Muhammad Imadudin
Make 2 Plots in GNU Octave / MATLAB

gnuoctave#matlab #tutorial #programmingtutorial #plot #coding #howto.

0:20
Make 2 Plots in GNU Octave / MATLAB

1,583 views

11 months ago

CAD and IPR Insights
How to plot 2D graphs in MATLAB (Part -1) #coding #india #analysis #cad #coding #maths

Description: Welcome to Part 1 of our MATLAB Plotting Series! In this video, you'll learn how to create 2D graphs in MATLAB ...

49:52
How to plot 2D graphs in MATLAB (Part -1) #coding #india #analysis #cad #coding #maths

68 views

8 months ago

Learn with Arisha
How to Plot 2D Contour in MATLAB | Complete Guide for Beginners

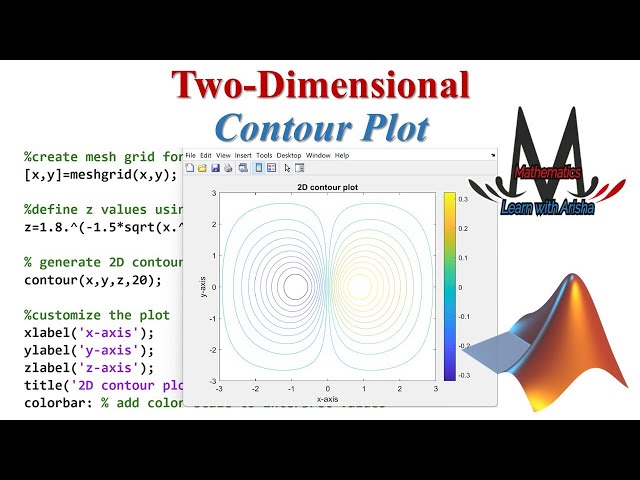
Learn how to create a 2D Contour Plot in MATLAB with this beginner-friendly tutorial! In this video, we guide you through each ...

7:08
How to Plot 2D Contour in MATLAB | Complete Guide for Beginners

267 views

8 months ago

KunYang Coastal
Plot Scattered XYZ Data in 2D Plane in Matlab

Kun Yang Coastal Engineer @ Stantec PhD in Coastal Engineering from the Univeristy of Florida. Thanks for Watching!

2:28
Plot Scattered XYZ Data in 2D Plane in Matlab

40 views

9 months ago

vlogize
Creating a 2D Plot of the Line y = x in MATLAB

Learn how to create a simple 2D plot of the line y = x using MATLAB's versatile plotting functions. --- Disclaimer/Disclosure: Some ...

1:26
Creating a 2D Plot of the Line y = x in MATLAB

0 views

10 months ago

Learn with Arisha
How to Plot a 2D Sine Wave in MATLAB | Easy 2D Plot Tutorial

In this MATLAB tutorial, you'll learn how to plot a 2D sine wave step by step. Whether you're a beginner or an advanced user, this ...

6:19
How to Plot a 2D Sine Wave in MATLAB | Easy 2D Plot Tutorial

183 views

9 months ago

engrSMART
Brief MATLAB Tutorial: Step-by-Step Guide to Create 2D Plots

Creating a 2D plot using MATLAB, Line style, Zoom in & out, Data tips, Hold figures, Comparison to Excel. ENGR 1131 ...

17:06
Brief MATLAB Tutorial: Step-by-Step Guide to Create 2D Plots

18 views

10 months ago

TODAYS TECH
Modeling and Simulation of Mass Spring Damper and Mass Spring System in MATLAB #matlab  #modelling

Get instant access to Project files ...

0:08
Modeling and Simulation of Mass Spring Damper and Mass Spring System in MATLAB #matlab #modelling

433,797 views

7 months ago

MAE Learning - My Automobile Engineering
👉 Creating a 3D surface plot in MATLAB is simple and useful for data visualization.  #matlab #script

Creating a 3D surface plot in MATLAB is simple and useful for data visualization. #matlab #script In this example, I used the ...

0:54
👉 Creating a 3D surface plot in MATLAB is simple and useful for data visualization. #matlab #script

770 views

2 months ago