Upload date
All time
Last hour
Today
This week
This month
This year
Type
All
Video
Channel
Playlist
Movie
Duration
Short (< 4 minutes)
Medium (4-20 minutes)
Long (> 20 minutes)
Sort by
Relevance
Rating
View count
Features
HD
Subtitles/CC
Creative Commons
3D
Live
4K
360°
VR180
HDR
10,801,839 results
You've probably heard the term data visualization thrown around a lot. It's why you're here, isn't it? So let's make it clear — data ...
177,414 views
3 years ago
View full lesson: http://ed.ted.com/lessons/david-mccandless-the-beauty-of-data-visualization David McCandless turns complex ...
1,560,918 views
13 years ago
Let's look at how we can implement design concepts and techniques to maximize the impact of our dashboards and reports.
85,075 views
4 years ago
Links mentioned in this video ⬇️ Exercise File ...
246,880 views
2 years ago
Data visualization is present in every aspect of our lives - but is it really as unbiased as it's said to be? In this SciToons video, learn ...
135,738 views
7 years ago
"️ IBM - Data Analyst ...
317,048 views
8 years ago
MENTORSHIP – Applications for the March 2026 cohort are now open! Apply here → https://theanalyticsaccelerator.com/ We're ...
44,388 views
9 months ago
Viewers like you help make PBS (Thank you ) . Support your local PBS Member Station here: http://to.pbs.org/Donateoffbook ...
507,834 views
12 years ago
http://www.ted.com David McCandless turns complex data sets (like worldwide military spending, media buzz, Facebook status ...
401,051 views
15 years ago
Setup, conflict, resolution. You know right away when you see an effective chart or graphic. It hits you with an immediate sense of ...
620,823 views
6 years ago
Effective data visualisation comes in many shapes and sizes, but how do you move away from a standard bar chart? Watch the ...
78,404 views
In this video Rob, a Kaggle Grandmaster, quickly and humorously walks through each of the popular plotting and data ...
109,090 views
10.3K subscribers
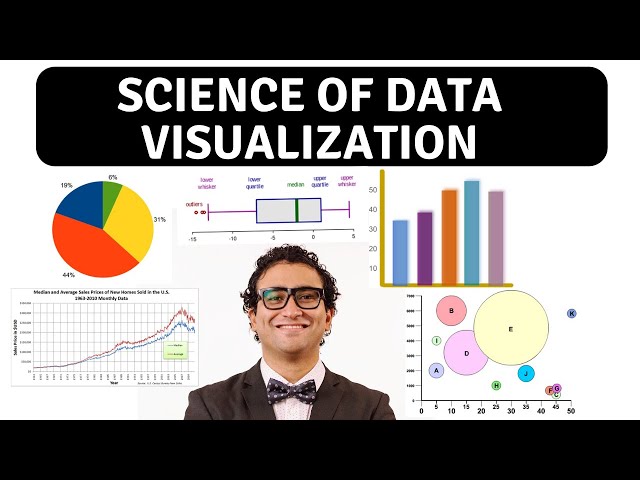
In this video, we will demonstrate the difference between data visualization charts including: - Bar Chart - Line Chart - Bubble ...
186,692 views
Learn Data Visualization with D3, JavaScript, and React. Part 2: https://youtu.be/H2qPeJx1RDI Created by @currankelleher .
518,599 views
Dustin hopes that the audience learns how anyone can use data visualization to improve their work, understand their world, and ...
72,072 views
En este video, te presento las 15 innovaciones tecnológicas más sorprendentes del CES 2025 que están listas para cambiar el ...
68,028 views
1 year ago
Si querés empezar a TRABAJAR como DISEÑADOR UX UI este video es para vos. Cuánto dinero se gana en el DISEÑO UX UI, ...
212,128 views
𝐓𝐑𝐀𝐍𝐒𝐅𝐎𝐑𝐌𝐀 𝐓𝐔 𝐕𝐈𝐃𝐀 with the secrets of the greatest 𝗠𝗲𝗻𝘁𝗲𝘀 in history! 🌟🧠💡 Do you want to achieve financial, mental, and ...
252,527 views
In this talk, I will chart the course of visual depictions of data over the last 200 years, from the classic data graphics of Playfair and ...
19,011 views
In this brief video, we define what data visualization is – and what it isn't – and how psychology plays a role in helping humans ...
6,754 views