Upload date
All time
Last hour
Today
This week
This month
This year
Type
All
Video
Channel
Playlist
Movie
Duration
Short (< 4 minutes)
Medium (4-20 minutes)
Long (> 20 minutes)
Sort by
Relevance
Rating
View count
Features
HD
Subtitles/CC
Creative Commons
3D
Live
4K
360°
VR180
HDR
133,154 results
In this video, I have solved an example on how to sketch the bode magnitude and phase plot. The book that I am referring to in this ...
652,609 views
9 years ago
By Ahmed Abu-Hajar, Ph.D. This is a Bode plot example to help my students in the Linear Controls course. I decided to share it ...
524,420 views
13 years ago
Visit http://ilectureonline.com for more math and science lectures! Before analyzing the Bode function for each of the 7 factors for a ...
185,987 views
6 years ago
Andrew Finelli, of UConn HKN, creates the Bode Plots for a given transfer function.
203,469 views
10 years ago
This video describes the benefit of being able to approximate a Bode plot by hand and explains what a Bode plot looks like for a ...
664,959 views
In this video, we will discuss how to draw the Bode plot from a given transfer function. This is Example 3 in this series where we ...
15,683 views
3 years ago
Explaining how to make approximations in the Bode plot of a frequency response, using the example G(s) = s + a.
75,848 views
11 years ago
In this video, we will discuss how to determine the transfer function from a Bode plot. Deriving a mathematical model of a plant is ...
58,062 views
4 years ago
In this last of 5 videos, we look at an example of plotting bode plots by hand.
33,199 views
www.gateece.org.
57,276 views
8 years ago
(a) Construct the Bode straight-line approximation magnitude and phase plots of H(s) using the paper-and-pencil method.
154,994 views
Example analyzing a second order system to find the damping ratio, natural frequency and gain. Also sketches the Bode plot ...
26,940 views
In this video we discuss how to generate a bode plot of a complex transfer function by decomposing it into the individual ...
23,488 views
Explore three popular methods to visualize the frequency response of a linear time-invariant (LTI) system: the Nichols chart, the ...
131,088 views
5 years ago
Bode plots are an essential but sometimes confusing tool for frequency domain analysis. In this video, we'll start with an intuitive ...
96,556 views
2 years ago
Going through how to draw the approximate bode plot for a system with one zero and two poles.
131,386 views
... and in particular describes the Bode plot. I go through how it is generated and why we use it to visualize the frequency response ...
1,371,196 views
Lecture 17 Exercise 102: How to draw a Bode plot, step by step - Bode Plot playlist with more examples: ...
25,826 views
In this video I have sketched the magnitude Bode plot for a transfer function Phase Plot for this transfer function: ...
75,844 views
7 years ago
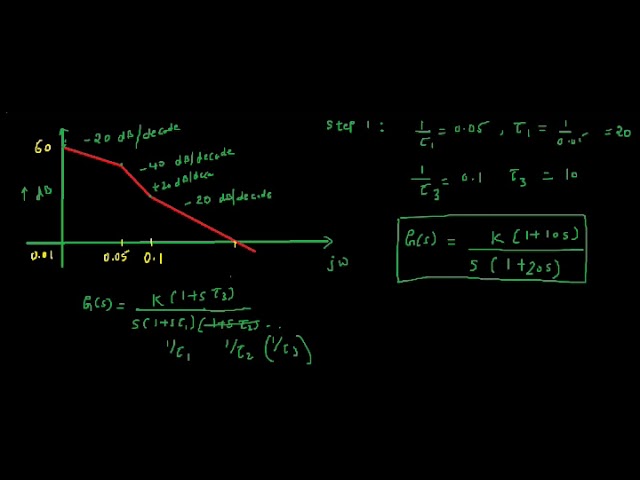
So what is the first step if you want to do the body plot what should we do maybe we should start by preparing the transfer function ...
4,594 views
Tutorial video for ECE 220 class at Mason.
405,207 views
In this video, I have plotted the magnitude plot of a transfer function.
48,311 views
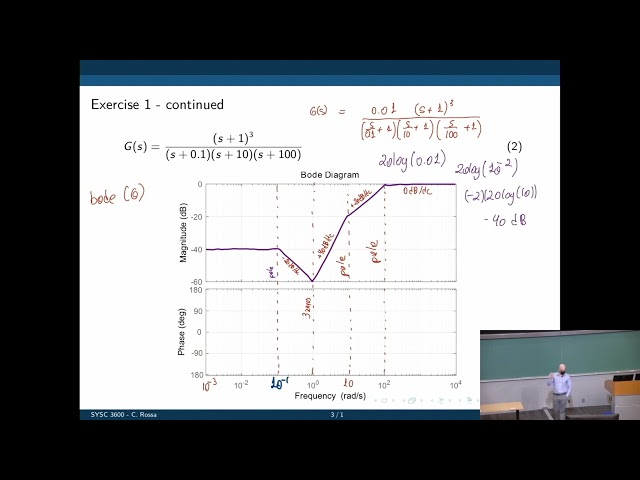
So our first question asks us to draw the bode plot for the following transfer function s plus 10 over s times s squared plus 3 s plus ...
17,489 views
Andrew Finelli of UConn HKN introduces an important Signals and Systems topic: creating a Bode Plot given a transfer function.
13,984 views