Upload date
All time
Last hour
Today
This week
This month
This year
Type
All
Video
Channel
Playlist
Movie
Duration
Short (< 4 minutes)
Medium (4-20 minutes)
Long (> 20 minutes)
Sort by
Relevance
Rating
View count
Features
HD
Subtitles/CC
Creative Commons
3D
Live
4K
360°
VR180
HDR
450 results
We have prepared a video tutorial about Matplotlib, which is a plotting library for the Python programming language and ...
658 views
4 years ago
Tutorial on how to plot bar chart with error bars in matplotlib python programming language. Also intuition of Error Bars in ...
5,660 views
5 years ago
Learn to plot graphs in Python in this tutorial! We cover matplotlib and show you how to get an awesome looking plot. As part of ...
56,178 views
In this video course, learn about Python Matplotlib and its concepts. Matplotlib is an open-source plotting library. Create interactive ...
37,753 views
2 years ago
In this tutorial, we will learn how to create charts in Python using the PyPlot library. We will be using Google Colab for Python ...
703 views
This video will show how to control what color each plot is when using Matplotlib.
520 views
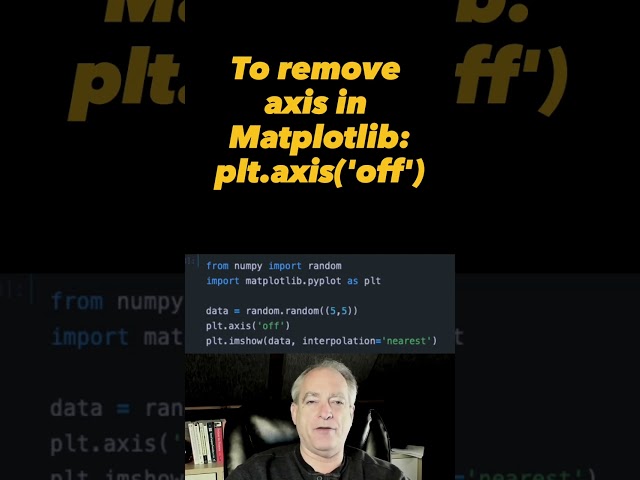
In this super short video, I show you how to remove the axis when plotting in Matplotlib. Useful for when your are plotting image ...
322 views
Create scatter plot with python, jupyter notebook, pandas and matplotlib using pyplot.plot What you will learn: 1. Create dataframe ...
276 views
6 years ago
Intro to Data Analysis Visualization with Python, Matplotlib and Pandas: Introduction and Overview: Time series and forecasting ...
6,340 views
3 years ago
► The PYTHON package matplotlib 📊 allows you to create basic visualizations in a simple way. In this video, we'll see how to ...
81,536 views
We are highly visual creatures; we understand things better when we see them visualized. However, the step of presenting ...
69,355 views
7 years ago
This is the video followed the numpy select video. Basically it's just showing the histogram of the daily return. What I want to show ...
225 views
UPDATE: The Series has been renamed to simply: Data Science and Machine Learning in Python This video is a detailed guide ...
279 views
In this lesson, learn what is PyPlot Submodule and run your first Matplotlib program. The PyPlot is a sub module and a lot of ...
9,327 views
Use plt.xticks() and plt.yticks() to specify which numbers have tick marks on your plots.
656 views
A tutorial illustrating how to generate random samples from various distributions, how to plot the samples in a histogram and how ...
1,145 views
Textbooks: https://amzn.to/2VmpDwK https://amzn.to/2GQSV3D https://amzn.to/2SvTOQx Welcome to Engineering Python. This is ...
1,309 views
8 years ago
In this lesson, we discuss the matplotlib Python library which can be used to make figures like this. This isn't the only Python tool, ...
139 views
In this lesson, learn to plot titles and position them in Matplotlib. To set the titles in a graph, use the title() function in Matplotlib.
3,326 views
Pyplot, Plot, Sine function.
514 views


![How to use MATPLOTLIB to make graphs 🐍💻 [Python Data Science Course in Spanish]](/api/proxy/image?url=https%3A%2F%2Fi.ytimg.com%2Fvi%2FXEG4eh5l_qU%2Fsddefault.jpg)


![How To Install Numpy, Pandas, and Matplotlib - Part 1 [4K]](/api/proxy/image?url=https%3A%2F%2Fi.ytimg.com%2Fvi%2FO2tbRhNB1Js%2Fsddefault.jpg)


