Upload date
All time
Last hour
Today
This week
This month
This year
Type
All
Video
Channel
Playlist
Movie
Duration
Short (< 4 minutes)
Medium (4-20 minutes)
Long (> 20 minutes)
Sort by
Relevance
Rating
View count
Features
HD
Subtitles/CC
Creative Commons
3D
Live
4K
360°
VR180
HDR
11,638 results
To learn for free on Brilliant, go to https://brilliant.org/techwithtim . Brilliant's also given our viewers 20% off an annual Premium ...
9,093 views
2 weeks ago
Title: Introduction to Matplotlib Auto-description: This video introduces Matplotlib, focusing on the importance of data ...
947 views
3 years ago
In this video course, learn about Python Matplotlib and its concepts. Matplotlib is an open-source plotting library. Create interactive ...
37,929 views
2 years ago
Welcome to a Matplotlib with Python 3+ tutorial series. In this series, we're going to be covering most aspects to the Matplotlib data ...
700,863 views
10 years ago
► The PYTHON package matplotlib 📊 allows you to create basic visualizations in a simple way. In this video, we'll see how to ...
81,676 views
5 years ago
Matplotlib Python Tutorial for Beginners | Data Visualization in Python Matplotlib is a python library used for data ...
8,443 views
Learn to plot graphs in Python in this tutorial! We cover matplotlib and show you how to get an awesome looking plot. As part of ...
56,786 views
Learn Data Analysis with Python in this comprehensive tutorial for beginners, with exercises included! NOTE: Check description ...
4,032,300 views
In this video Rob, a Kaggle Grandmaster, quickly and humorously walks through each of the popular plotting and data ...
109,449 views
4 years ago
Tutorial on how to plot bar chart with error bars in matplotlib python programming language. Also intuition of Error Bars in ...
5,667 views
[हिन्दी] In this video course, learn about Python Matplotlib and its concepts in Hindi. Matplotlib is an open-source plotting ...
20,518 views
Explore Matplotlib, the Python library for data visualization. This beginner-friendly tutorial covers fundamental chart creation, ...
170 views
Matplotlib shortcut every Python programmer and Data Scientist needs to know! Learn how to effortlessly style your plots with ...
500 views
1 year ago
box #programming #python In this video, it is informed that box plot is generated to assess the percentile of data distribution from ...
267 views
Matplotlib python #short #tutorial - on basics of creating bar chart which is best suited for comparing categorical data.
240 views
Use the axes to add titles to each subplot in Matplotlib.
287 views
In this lesson, learn what is Matplotlib with its features. Matplotlib is an open-source plotting library developed by John D. Hunter.
24,490 views
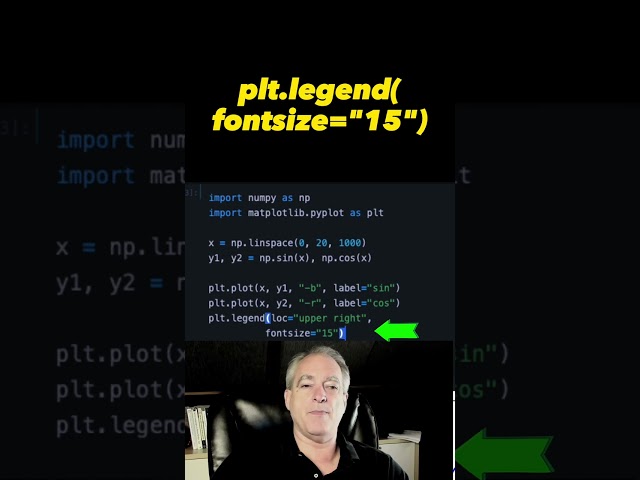
This video will show you how to control the Matplotlib legend size by controlling the font size used in the legend.
519 views
How can you actually fit data to a probability distribution in practice? Today, I provide a 60 second tutorial on how to do so in ...
22,029 views
Visit https://postmarkapp.com/lp/tech-with-tim and use coupon code TECHWITHTIM to get 20% off any plan for three months.
157,486 views
6 months ago


![How to use MATPLOTLIB to make graphs 🐍💻 [Python Data Science Course in Spanish]](/api/proxy/image?url=https%3A%2F%2Fi.ytimg.com%2Fvi%2FXEG4eh5l_qU%2Fsddefault.jpg)