Upload date
All time
Last hour
Today
This week
This month
This year
Type
All
Video
Channel
Playlist
Movie
Duration
Short (< 4 minutes)
Medium (4-20 minutes)
Long (> 20 minutes)
Sort by
Relevance
Rating
View count
Features
HD
Subtitles/CC
Creative Commons
3D
Live
4K
360°
VR180
HDR
906 results
Review code better and faster with my 3-Factor Framework: https://arjan.codes/diagnosis. In this video, I'll share 15 Python ...
452,355 views
2 years ago
Hello Everyone! Today in this video I am going to step-by-step guide you on How to install Matplotlib on Python 3.11.2 on ...
88,608 views
Hello Everyone! Today, in this video, I am going to step-by-step guide you on How to install Matplotlib with the latest Python 3.13 ...
969 views
4 months ago
This video shows how to install matplotlib on Python 3.13. It will walk you through, step-by-step, how to install matplotlib on Python ...
1,859 views
1 year ago
Learn Data Analysis with Python in this comprehensive tutorial for beginners, with exercises included! NOTE: Check description ...
3,989,140 views
5 years ago
Learn to plot graphs in Python in this tutorial! We cover matplotlib and show you how to get an awesome looking plot. As part of ...
53,550 views
Click this link https://sponsr.is/bootdev_TechWithTim and use my code TECHWITHTIM to get 25% off your first payment for ...
625,451 views
11 months ago
Data analysis using Python; https://ibm.biz/Using_Python Beginner's guide to python; https://ibm.biz/Python_for_beginners If ...
258,977 views
Earn your Python Certificate → https://ibm.biz/Bdy8Eb NumPy and SciPy are two Python libraries that on the surface, appear to ...
64,522 views
In this video, learn how to install matplotlib on Windows 10. We will also install Python 3 and pip. PIP is used to install and ...
11,603 views
In this video about exploratory data analysis with pandas and python, Kaggle grandmaster Rob Mulla will teach you the basics of ...
644,315 views
3 years ago
This video explains about the need of Data Visualization and its explains various types of visualizations like bar chart, histogram, ...
488 views
This Python data science course will take you from knowing nothing about Python to coding and analyzing data with Python using ...
4,599,168 views
Short but accurate guide to setup matplotlib on a computer running Windows Operating System. It uses 'pip'. SUMMARY: 1.
150,387 views
9 years ago
Learn the basics of Python, Numpy, Pandas, Data Visualization, and Exploratory Data Analysis in this course for beginners.
3,137,264 views
4 years ago
Visit https://postmarkapp.com/lp/tech-with-tim and use coupon code TECHWITHTIM to get 20% off any plan for three months.
124,386 views
In this quick video, we'll show you how to add a legend to a Matplotlib plot. This is a quick and easy way to improve the ...
236 views
Learn Excel in just 2 hours: https://kevinstratvert.thinkific.com In this step-by-step tutorial, learn how you can use Python in ...
505,821 views
Organized by textbook: https://learncheme.com/ 21st screencast of a series on Python. Made by faculty at the New Jersey Institute ...
1,060 views
Using Python and curious how to use it with Power BI? Patrick explores how you can do just that! Python + Power BI can be a ...
378,464 views
Use plt.xticks() and plt.yticks() to specify which numbers have tick marks on your plots.
635 views
Matplotlib python #short #tutorial - on basics of creating bar chart which is best suited for comparing categorical data.
234 views
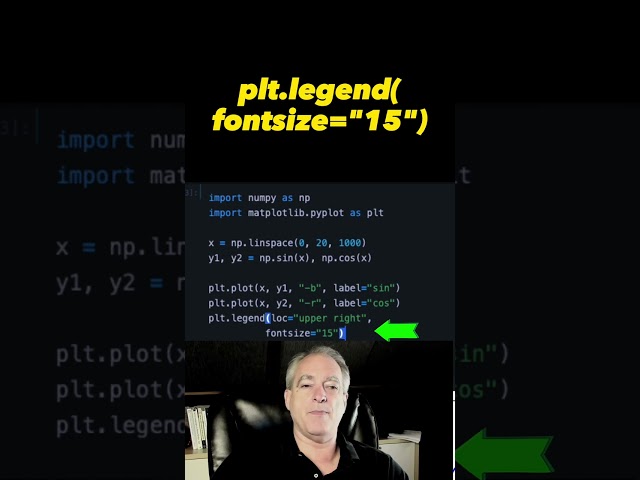
This video will show you how to control the Matplotlib legend size by controlling the font size used in the legend.
510 views
Three-dimensional (3D) Line Chart Plotting in Python using Matplotlib (mplot3d tutorial). ➖ In this Video, we wall talk about how to ...
2,308 views
Use the built-in ensurepip python -m ensurepip.
29,440 views

![How to Install Matplotlib on Python 3.11.2 on Windows 11 [ 2023 Update ] Complete Guide](/api/proxy/image?url=https%3A%2F%2Fi.ytimg.com%2Fvi%2FEmBntQAnWyc%2Fsddefault.jpg)
![How to Install Matplotlib with latest Python 3.13 on Windows 10/11 [ 2025 Update ] Complete Guide](/api/proxy/image?url=https%3A%2F%2Fi.ytimg.com%2Fvi%2FEw6QLDd20U0%2Fsddefault.jpg)