Upload date
All time
Last hour
Today
This week
This month
This year
Type
All
Video
Channel
Playlist
Movie
Duration
Short (< 4 minutes)
Medium (4-20 minutes)
Long (> 20 minutes)
Sort by
Relevance
Rating
View count
Features
HD
Subtitles/CC
Creative Commons
3D
Live
4K
360°
VR180
HDR
151,129 results
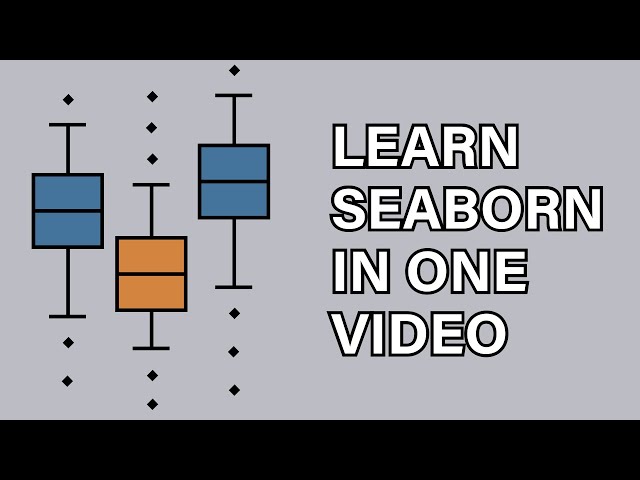
This video is about Seaborn, an external Python data visualization library, which is based on Matplotlib.
220,852 views
3 years ago
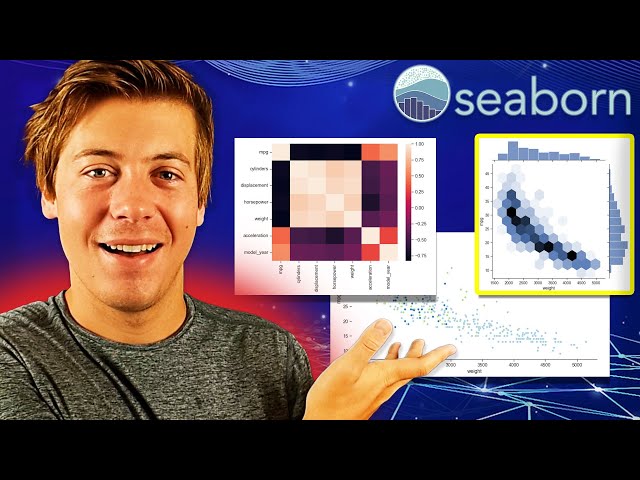
New Data Science / Machine Learning Video Everyday at 1 PM EST!!! [ Click Notification Bell ] This video provides complete ...
253,602 views
5 years ago
This first video of my "Introduction to Seaborn" series covers the basics of seaborn, a Python library for data visualization. Here ...
79,182 views
This Seaborn Full Course by Intellipaat is your one-stop guide to mastering data visualization in Python using Seaborn. Perfect for ...
38,865 views
5 months ago
Don't miss out! Get FREE access to my Skool community — packed with resources, tools, and support to help you with Data, ...
7,838 views
2 years ago
"️️ Professional Certificate in AI and Machine Learning, delivered by Simplilearn in collaboration with Purdue University ...
52,855 views
4 years ago
In this video Rob, a Kaggle Grandmaster, quickly and humorously walks through each of the popular plotting and data ...
107,766 views
If you work with data in Python, at some point you'll need to visualize it. In this video, I'll show you the differences ...
1,530 views
8 months ago
Python Certification Training: https://www.edureka.co/data-science-python-certification-course ** This Edureka video on 'Python ...
132,120 views
Streamed 6 years ago
In my last video, I showed how elegant and simple plotnine makes the Grammar of Graphics in Python. This time, I put Seaborn's ...
325 views
3 months ago
Curso Estadística Descriptiva: https://codificandobits.com/curso/estadistica-descriptiva/ Asesorías y formación ...
2,304 views
4 months ago
The Colab Notebook: https://colab.research.google.com/drive/1GZTU5pApz-kL79aaFjiSlhu6_Bf1ZDSz?usp=sharing California ...
6,022 views
Learn how you can quickly make statistical visuals in Seaborn, Python's best library for data visualization. Find the notebook here: ...
17,136 views
Learn Data Analysis with Python in this comprehensive tutorial for beginners, with exercises included! NOTE: Check description ...
3,990,957 views
Intellipaat Python course: https://intellipaat.com/python-certification-training-online/ In this python seaborn tutorial you will what is ...
7,601 views
Hi Everyone, I'm excited to announce my brand-new *Udemy* course available at ONLY 399INR/$9.99USD: Learn to build ...
84,523 views
6 years ago
From the "675: Pandas for Data Analysis and Visualization" in which @JonKrohnLearns speaks with the author of 'Hands-On Data ...
5,725 views
The Seaborn pairplot allows us to easily take a dataframe and generate a single figure showing the relationships between all of ...
9,024 views
This Seaborn relplot tutorial video shows you how to visualize variable relationships with the relplot. I first walk you through the ...
10,268 views
Data Used: https://www.nasdaq.com/market-activity/stocks/aapl/historical Google Colab Link: https://colab.research.google.com/ ...
8,771 views
In this video, I will provide a high-level overview of the Top 5 Python libraries for Data Visualization that you can use to create ...
54,543 views
Welcome to the Complete Data Visualization in Python Course! In this full video tutorial, we're diving deep into the world of ...
72,356 views
7 months ago
Learn how to create and customize data visualizations using Seaborn in Python. This tutorial covers essential plotting techniques ...
710 views
6 months ago