Upload date
All time
Last hour
Today
This week
This month
This year
Type
All
Video
Channel
Playlist
Movie
Duration
Short (< 4 minutes)
Medium (4-20 minutes)
Long (> 20 minutes)
Sort by
Relevance
Rating
View count
Features
HD
Subtitles/CC
Creative Commons
3D
Live
4K
360°
VR180
HDR
901 results
In this video, you'll learn Seaborn, one of the most powerful Python libraries for data visualization, using 10 clear and practical ...
60 views
1 day ago
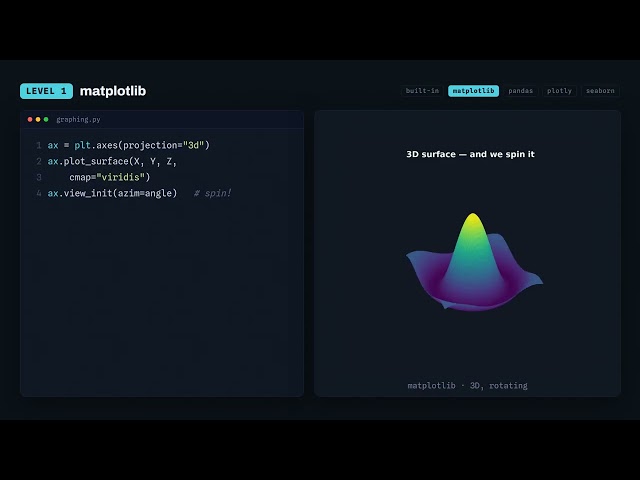
Matplotlib is Python's most powerful data visualization library — and most tutorials only scratch the surface. This crash course ...
23 views
7 days ago
In this video, I built a complete end-to-end ETL pipeline using live football match data! What you'll see in this video: ...
12 views
6 days ago
Learn Plotly fundamentals and build a strong coding foundation. Perfect for beginners interested in AI, machine learning, and ...
9 views
5 days ago
Welcome to Video 15 of the Data Analysis with Python Series by PowerPro Academy! In this project-based tutorial, we work ...
48 views
A quick tutorial on different ways to use Python to produce high quality graphs. If you want to download the code from this video, ...
0 views
Free 10-Day Data Engineer Crash Course https://lukeb.co/de-crash-course Data Engineer Course Bundle (470+ interview ...
47,653 views
These python data visualization skills are essential for anyone looking to bridge the gap between backend data processing and ...
39 views
Create Stunning Pie Charts in Python | Matplotlib Step-by-Step Tutorial In this video, you will learn how to create a beautiful pie ...
4 views
In this video, I build a Python project to analyze data and discover which skills are currently trending. Using Python libraries for ...
4 days ago
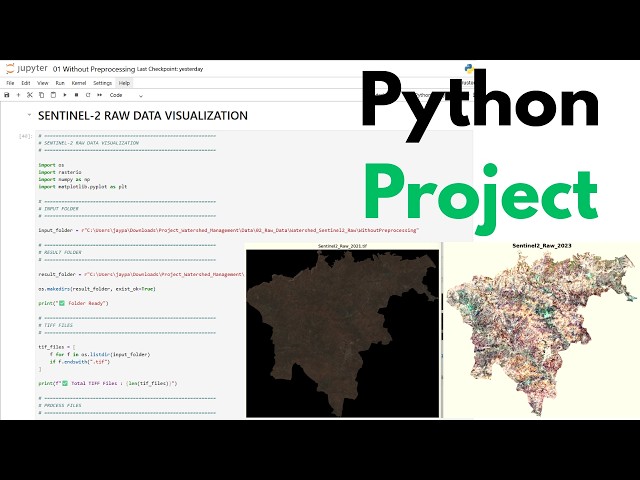
Hello Friends, Welcome to DoITNew. In this video, I will show you how to visualize Sentinel-2 satellite data using Python ...
29 views
Namaste dosto! Is video mein maine Matplotlib ko bahut hi simple language mein explain kiya hai. Agar aap Python seekh ...
Master Netflix Data Analysis using Python with 49 Advanced Business Questions! In this video, you'll learn how to solve real-world ...
31 views
Learn how to create powerful and professional data visualizations using Matplotlib, one of the most popular Python libraries for ...
3 views
Welcome to Day 115 of the NetGuardians Certified Basic of Python Programming. 6 Month journey to become confident in Python ...
22 hours ago
Unlock the secrets to creating impactful market research visuals using Python! In this video, we dive into expert techniques that ...
Free data analytics sources - https://stan.store/KarinaDataScientist/p/free-data-analytics-resources SQL and Python challenge ...
2,419 views
Yan Holtz, the data viz educator behind data-to-viz.com and the R/Python/D3 graph galleries, joins Mehdi and Alex for a full ...
427 views
10 views
Hello Friends, In this video, I will show you how to download Sentinel-2 satellite data using Python and Google Earth Engine ...
53 views