Upload date
All time
Last hour
Today
This week
This month
This year
Type
All
Video
Channel
Playlist
Movie
Duration
Short (< 4 minutes)
Medium (4-20 minutes)
Long (> 20 minutes)
Sort by
Relevance
Rating
View count
Features
HD
Subtitles/CC
Creative Commons
3D
Live
4K
360°
VR180
HDR
679 results
LLMs are powerful… but they hallucinate And that's exactly where GraphRAG comes in. In this video, we go deep into ...
131 views
1 month ago
In this video, we'll go through 10 real-world Bokeh examples to help you master interactive data visualization with Python.
312 views
3 weeks ago
LangGraph | LangChain | Agentic AI | AI Agents | LangGraph Tutorial What you will learn? This is a complete beginner-friendly ...
12,113 views
2 weeks ago
Welcome to Leansimcorp! For any inquiries, feel free to reach out to us at: Email: leansimcorp@gmail.com Purchase Our ...
0 views
13 hours ago
https://amzn.to/4aLHbLD You're literally one click away from a better setup — grab it now! As an Amazon Associate I earn ...
9 views
PLAYLIST: https://www.youtube.com/playlist?list=PLodDUjBzx6qg1z0pShj2_PNfQ8oTX5wEu AoC: ...
7 views
7 days ago
1 day ago
2 days ago
About the Python Exchange for the Department of Energy: https://meetup.doepy.org/ Sign up here to be notified when the next ...
134 views
Unlock the power of structured memory for your AI agents! In this video, we dive into integrating Neo4j with Mem0 to create a ...
19 views
In this video I explain how to create different graphs for quantitative variables in Python, such as: histograms, frequency ...
27 views
10 days ago
In this video, I demonstrate how Autodesk Assistant (Alpha), powered by AI and MCP, can automatically convert an entire Dynamo ...
98 views
In this video, we focus on Plotting and how to visualize data effectively using Python. Learn the fundamentals of creating clear and ...
30 views
11 days ago
1 view
5 days ago
6 views
Try @dokie.ai: https://dokie.ai/?utm_atefataya=pixie_tec&utm_medium=YouTube&utm_campaign=February Create professional ...
96,284 views
PageRank explained: turn link structure into a stable importance score and a simple recommender. Build a directed graph, ...
8 views
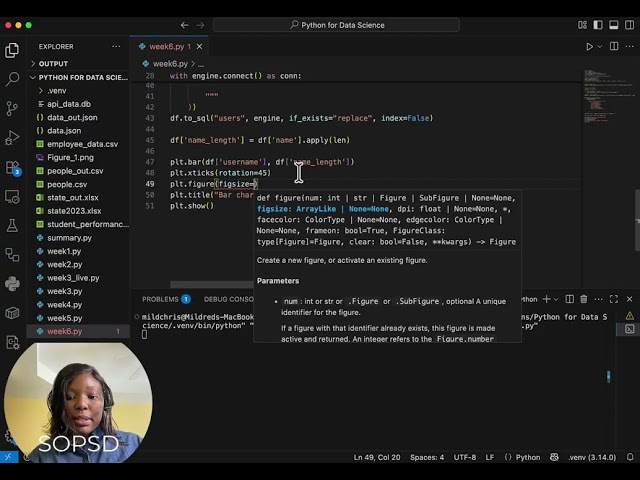
School of Programming and Software Development sop-AI-101: Python for Data Science This lesson introduces students to ...
31 views
This video explains how to create graphs for qualitative variables in Python, such as bar charts and pie charts.
34 views
In this tutorial, we'll walk you through creating a simple Python web app from scratch using Streamlit and Matplotlib. By the end ...
310 views


![Advent of Code 2025 Day 8: Graphs and Union-Find [Python]](/api/proxy/image?url=https%3A%2F%2Fi.ytimg.com%2Fvi%2FOh18kwajrzk%2Fsddefault.jpg)