Upload date
All time
Last hour
Today
This week
This month
This year
Type
All
Video
Channel
Playlist
Movie
Duration
Short (< 4 minutes)
Medium (4-20 minutes)
Long (> 20 minutes)
Sort by
Relevance
Rating
View count
Features
HD
Subtitles/CC
Creative Commons
3D
Live
4K
360°
VR180
HDR
9,947,076 results
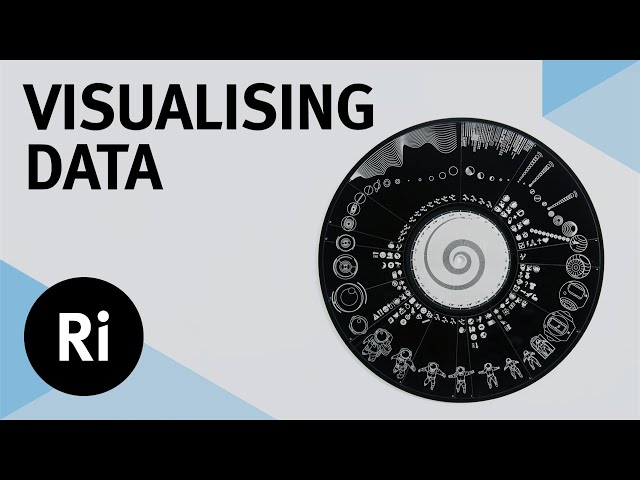
Effective data visualisation comes in many shapes and sizes, but how do you move away from a standard bar chart? Watch the ...
80,713 views
5y ago
View full lesson: http://ed.ted.com/lessons/david-mccandless-the-beauty-of-data-visualization David McCandless turns complex ...
1,585,764 views
13y ago
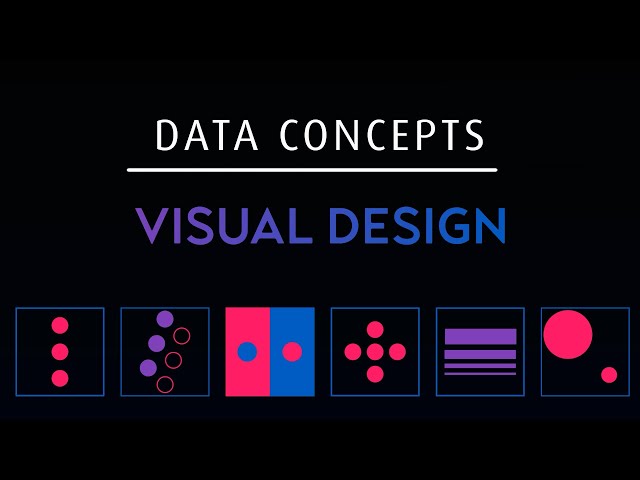
Let's look at how we can implement design concepts and techniques to maximize the impact of our dashboards and reports.
90,582 views
Links mentioned in this video ⬇️ Exercise File ...
255,764 views
3y ago
Watch this mini-workshop delivered by best-selling author Cole Nussbaumer Knaflic. Cole demonstrates how to transform graphs ...
341,074 views
Streamed 2y ago
You've probably heard the term data visualization thrown around a lot. It's why you're here, isn't it? So let's make it clear — data ...
188,961 views
4y ago
MENTORSHIP – Applications for the next cohort are open! Apply here → https://theanalyticsaccelerator.com/ We're looking for ...
62,196 views
1y ago
Setup, conflict, resolution. You know right away when you see an effective chart or graphic. It hits you with an immediate sense of ...
659,114 views
6y ago
Dustin hopes that the audience learns how anyone can use data visualization to improve their work, understand their world, and ...
74,934 views
MIT 14.310x Data Analysis for Social Scientists, Spring 2023 Instructor: Esther Duflo View the complete course: ...
103,526 views
2y ago
Nano Banana + Gemini 3: The Data Visualization Workflow You Need | Stop Making Boring Charts – Use This Nano Banana + ...
26,901 views
6mo ago
In this video, I break down some of the 'science' behind effective data visualization and how you can build better dashboards by ...
389,324 views
Welcome to the Complete Data Visualization in Python Course! In this full video tutorial, we're diving deep into the world of ...
156,435 views
Viewers like you help make PBS (Thank you ) . Support your local PBS Member Station here: http://to.pbs.org/Donateoffbook ...
514,700 views
Following a look at 'Sensemaking' Associate Professor Dr Kai Xu delves into some more tricks of the visualisation trade.
75,673 views
Find out how data visualization transforms the way we consume information—and why it's such a powerful force in marketing and ...
175,593 views
14y ago
Data visualization is present in every aspect of our lives - but is it really as unbiased as it's said to be? In this SciToons video, learn ...
145,707 views
7y ago
Save up to 50% off Maven Pro Plans! ➡️ https://bit.ly/4cXXTHo Data storytelling is one of the most important skills for any data ...
26,670 views
This comprehensive tutorial will teach you everything you need to know about Excel chart types, chart customization, and creating ...
117,561 views
Data visualization, Bar chart, Line Chart, Pie chart, Scatter Plot, Pictogram, Histogram,Heat maps, tree maps, Dot plot, Stem and ...
5,492 views
7mo ago