ViewTube

ViewTube
Sign inSign upSubscriptions
Filters

Upload date

Type

Duration

Sort by

Features

Reset

93 results

ThirdEye Labs
Lab_01: Build a Learning Function in Python — From Scratch

A function is the single most important idea in all of AI — and it's simpler than you think. Here's the visual intuition behind every ...

3:37
Lab_01: Build a Learning Function in Python — From Scratch

97 views

3 weeks ago

Luke Barousse
Data Engineer Bootcamp (FREE 27+ Hour Course) - SQL, Python, Cloud, Bash, AI, Git & GitHub

Free 10-Day Data Engineer Crash Course https://lukeb.co/de-crash-course Data Engineer Course Bundle (470+ interview ...

27:19:55
Data Engineer Bootcamp (FREE 27+ Hour Course) - SQL, Python, Cloud, Bash, AI, Git & GitHub

58,180 views

9 days ago

CS Master
Installing and Importing Matplotlib | Data Visualization | pyplot methods | matplotlib.pyplot

Installing and Importing Matplotlib | Data Visualization | pyplot methods | matplotlib.pyplot Hello viewers, Myself Sandip Srivastav, ...

11:12
Installing and Importing Matplotlib | Data Visualization | pyplot methods | matplotlib.pyplot

20 views

6 days ago

Chemistry with Fun: Tutorials, Stories, & Games
Ep.15. Simulating Titration Curves with NumPy & Matplotlib!

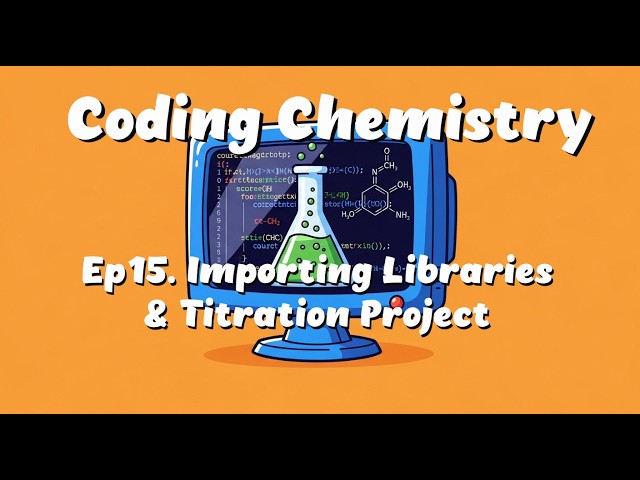
In this tutorial, we step outside Python's built-in tools to harness the power of external libraries. If you've ever wanted to turn raw ...

6:07
Ep.15. Simulating Titration Curves with NumPy & Matplotlib!

30 views

2 weeks ago

CS Master
Common Types of Charts in pyplot| Components of chats in PyPlot | mathplotlib | python | class 12

Common Types of Charts in pyplot| Components of chats in PyPlot | mathplotlib | python | class 12 Hello viewers, Myself Sandip ...

11:16
Common Types of Charts in pyplot| Components of chats in PyPlot | mathplotlib | python | class 12

9 views

2 days ago

Luke Barousse
Data Analyst Bootcamp (FREE 35+ Hour Full Course) - SQL, Excel, Power BI, Python, AI & GitHub

Free 5-Day Data Analyst Crash Course https://lukeb.co/da-crash-course Data Analyst Course Bundle (400+ interview problems ...

35:37:05
Data Analyst Bootcamp (FREE 35+ Hour Full Course) - SQL, Excel, Power BI, Python, AI & GitHub

88,233 views

3 weeks ago

Steve Learning
Complete Python Data Analysis Tutorial for Beginners: A Step-by-Step Introduction

Welcome to this comprehensive introduction to Data Analysis using Python. If you are looking to turn raw data into actionable ...

12:28
Complete Python Data Analysis Tutorial for Beginners: A Step-by-Step Introduction

4 views

1 day ago

Proto Bioengineering
(Old version) How to Graph an Electrocardiogram (EKG) in Python (Complete Beginner)

A better version of this video is now uploaded here: https://youtu.be/RUZuXihqDDM Create a graph of heartbeats from an EKG (as ...

23:41
(Old version) How to Graph an Electrocardiogram (EKG) in Python (Complete Beginner)

38 views

3 weeks ago

Alexander Booth
IBM IBSC 2026-04-08 | Module 6 Live Session | Data Visualization, Plotly Dash & Data Apps

In this live session for Module 6 of the IBM Data Science Professional Certificate, IBSC 2026-04-08 cohort, we explore data ...

1:19:13
IBM IBSC 2026-04-08 | Module 6 Live Session | Data Visualization, Plotly Dash & Data Apps

27 views

4 weeks ago

pyverse
Complete Python & Anaconda Setup Guide for Windows 11 (Pip, Jupyter, & python Libraries) 2026

Ready to start your Python programming and Data Science journey? In this ultimate step-by-step tutorial, we cover exactly how to ...

16:03
Complete Python & Anaconda Setup Guide for Windows 11 (Pip, Jupyter, & python Libraries) 2026

32 views

4 weeks ago

CS Master
Creating Line Chart using plot Function | xlabel() | ylabel() | grid() | figure() | plot() attribute

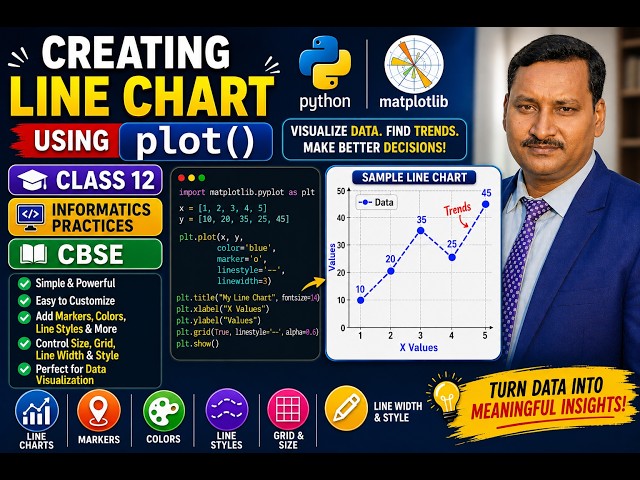
Creating Line Chart using plot Function | xlabel() | ylabel() | grid() | figure() | attributes of plot() Hello viewers, Myself Sandip ...

32:29
Creating Line Chart using plot Function | xlabel() | ylabel() | grid() | figure() | plot() attribute

5 views

1 day ago

Alexander Booth
IBM IBDA 2026-04-01 | Module 8 Live Session | Data Visualization, Dashboards & Data Apps

In this live session for Module 8 of the IBM Data Analytics Professional Certificate, IBDA 2026-04-01 cohort, we explore data ...

1:18:07
IBM IBDA 2026-04-01 | Module 8 Live Session | Data Visualization, Dashboards & Data Apps

27 views

3 weeks ago

SFU Data & Dialogue Lab
Making GOOD visualizations with python - Week 4 Lab - IAT461

Histograms, Box Plots, Scatter Plots & Genre Trends Dr. Karduni runs a code-along lab using a shared synthetic asking students ...

59:08
Making GOOD visualizations with python - Week 4 Lab - IAT461

63 views

3 weeks ago

SRR Strategic Intelligence
AI-Powered PCA - Turning 100 Metrics into 3 Insights with Python

Principal Component Analysis (PCA) is one of the most powerful techniques for turning large amounts of data into meaningful ...

27:10
AI-Powered PCA - Turning 100 Metrics into 3 Insights with Python

107 views

2 weeks ago

Decoding Phys!cs
Estimating π Using Randomness | The Monte Carlo Method

mathematics #montecarlo #python How Monte Carlo Simulation Approximates π | The Geometry Behind Randomness What does ...

5:03
Estimating π Using Randomness | The Monte Carlo Method

33 views

1 day ago

SRR Strategic Intelligence
TOPSIS Explained: AI-Powered Decision Making with Python (Complete Business Guide)

Organizations make thousands of decisions every year. Which projects deserve funding? Which vendors should be selected?

14:33
TOPSIS Explained: AI-Powered Decision Making with Python (Complete Business Guide)

49 views

10 days ago

SRR Strategic Intelligence
AI-Powered Efficient Frontiers for Project Portfolios using Free Tools

How do you choose the best combination of projects when you have limited budget, limited resources, and too many good ideas?

21:04
AI-Powered Efficient Frontiers for Project Portfolios using Free Tools

651 views

3 weeks ago

Learning with Rodo
Scikit-learn for Beginners — Train, Predict & Evaluate Your First ML Model | Python ML Course Ch. 5

Learn how Scikit-learn supports the complete introductory machine-learning workflow — from loading or generating data, ...

26:25
Scikit-learn for Beginners — Train, Predict & Evaluate Your First ML Model | Python ML Course Ch. 5

16 views

12 days ago

Amit Thinks
How to install Python 3.14.6 on Windows 10

In this video, learn to download and install Python 3.14.6 on Windows 10. We will also run a sample Python code. Python Tutorial ...

3:15
How to install Python 3.14.6 on Windows 10

676 views

9 days ago

Alexander Booth
IBM IBDA 2026-04-01 | Week 4 Live Session | Python, Programming Fundamentals & Data Structures

Week 4 live session for the IBM Data Analytics Bootcamp, IBDA 2026-04-01 cohort. In this back-recorded session, we move from ...

1:31:53
IBM IBDA 2026-04-01 | Week 4 Live Session | Python, Programming Fundamentals & Data Structures

27 views

2 weeks ago