Upload date
All time
Last hour
Today
This week
This month
This year
Type
All
Video
Channel
Playlist
Movie
Duration
Short (< 4 minutes)
Medium (4-20 minutes)
Long (> 20 minutes)
Sort by
Relevance
Rating
View count
Features
HD
Subtitles/CC
Creative Commons
3D
Live
4K
360°
VR180
HDR
898 results
python #coding #matplotlib This video serves as an introduction to the Matplotlib Python library. We'll cover the basics of ...
78,329 views
3 months ago
Register for Intellipaat's Premium Data Science Course: https://intellipaat.com/data-scientist-course-training/ Access the ...
91,669 views
7 months ago
In this video, you'll learn how to install the matplotlib library in Python. It shows how to use the pip command to install ...
459 views
python #coding #matplotlib Matplotlib is a Python library used for data visualization. It provides a MATLAB-like interface for quick ...
24,181 views
4 months ago
In this video, learn how to install matplotlib on Windows. We will also install Python 3 and pip. PIP is used to install and manage ...
2,384 views
2 months ago
Python Code: import matplotlib.pyplot as plt x = [1, 2, 3, 4, 5] y = [1, 4, 9, 16, 25] plt.plot(x, y, linewidth=3, marker='+', color='green') ...
12,144 views
python #coding #matplotlib In this video I will show you how to create subplots using Matplotlib.
7,802 views
Link: https://darekdari.com/matplotlib-guide-python/ In this video, you'll learn Matplotlib in Python from scratch, perfect for ...
11 views
1 month ago
How to Install Matplotlib in Visual Studio Code (VS Code) | Step-by-Step Guide Want to create **beautiful data visualizations** ...
32,325 views
10 months ago
python #coding #matplotlib In this video we will create a basic scatter plot using Matplotlib. Here is some sample data you can ...
6,851 views
Recorded during a live class session on 4-14-25 for GTC. This covers Unit 11 Python Exercise for the Toolbox 7.4 coding for ...
90 views
9 months ago
Recorded during a live class session on 4-7-25 for GTC. This covers Unit 10 Python Exercise for the Covid 19 Data using Python ...
27 views
Learn how to create stunning scatter plots using Matplotlib in Python! In this tutorial, we'll walk you through the basics of scatter ...
249 views
jupyter notebook python random number; matplotlib.pyplot 2d plot generation.
21 views
In this video of Joey'sTECH, I will show you how to install matplotlib in Python on Windows 11. I will tell you how to ...
168 views
Discover how to resolve the issue of saving blank images and displaying plots in Jupyter Notebooks when using Matplotlib.
98 views
8 months ago
Masters In Data-Analytics with GenAI with Job Guarantee Program - https://codingwise.in/program/data-analytics Python for Data ...
212,685 views
python #coding #matplotlib In this video we will create a simple bar chart using matplotlib.
6,143 views
How to Create a Simple Scatter Plot in Python In this quick and beginner-friendly tutorial, you'll learn how to create a simple ...
15 views
6 months ago
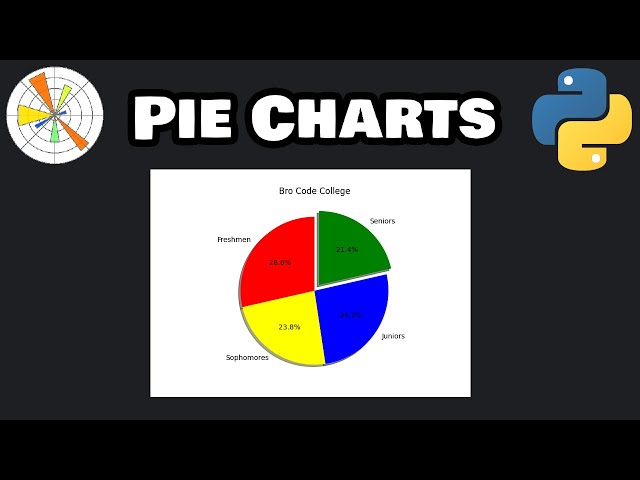
python #coding #matplotlib In this video we will create a basic pie chart using Matplotlib.
7,274 views
If you work with data in Python, at some point you'll need to visualize it. In this video, I'll show you the differences ...
1,688 views
Hi everyone, Hope everyone is doing great :) In this video, I have covered - Class: 12th Subject: INFORMATICS PRACTICES ...
77,395 views
This video gives a simple guide on how to work with dates and modules in Python. You will learn how to import and use libraries ...
16 views
In this video, we dive into Exploratory Data Analysis (EDA) using powerful Python libraries like pandas, numpy, matplotlib, and ...
3,254 views
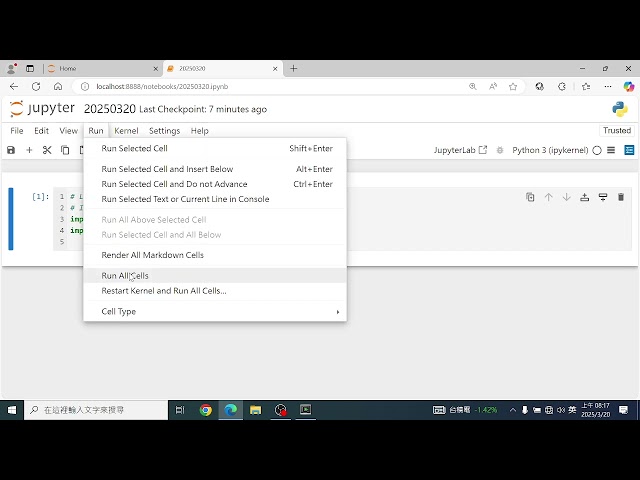
Need to **visualize data in Jupyter Notebook**? **Matplotlib** is the go-to Python library for creating **charts, graphs, and ...
2,287 views


![How to Install Matplotlib with latest Python 3.14 on Windows 10/11 [2025 Update] Matplotlib Tutorial](/api/proxy/image?url=https%3A%2F%2Fi.ytimg.com%2Fvi%2FJqTjyPhRHMw%2Fsddefault.jpg)