Upload date
All time
Last hour
Today
This week
This month
This year
Type
All
Video
Channel
Playlist
Movie
Duration
Short (< 4 minutes)
Medium (4-20 minutes)
Long (> 20 minutes)
Sort by
Relevance
Rating
View count
Features
HD
Subtitles/CC
Creative Commons
3D
Live
4K
360°
VR180
HDR
18 results
Matplotlib is Python's most powerful data visualization library — and most tutorials only scratch the surface. This crash course ...
5 views
10 hours ago
import matplotlib.pyplot as plt → Imports Matplotlib plotting module. plt.plot(x, y) → Draws a line graph. plt.title() → Adds a graph ...
12 views
2 days ago
Adding text into bar-chart graph in Matplotlib (Python) Helpful? Please use the *Thanks* button above! Or, thank me via Patreon: ...
8 views
6 days ago
Can't remove matplotlib's padding around imshow() figure Helpful? Please use the *Thanks* button above! Or, thank me via ...
0 views
14 minutes ago
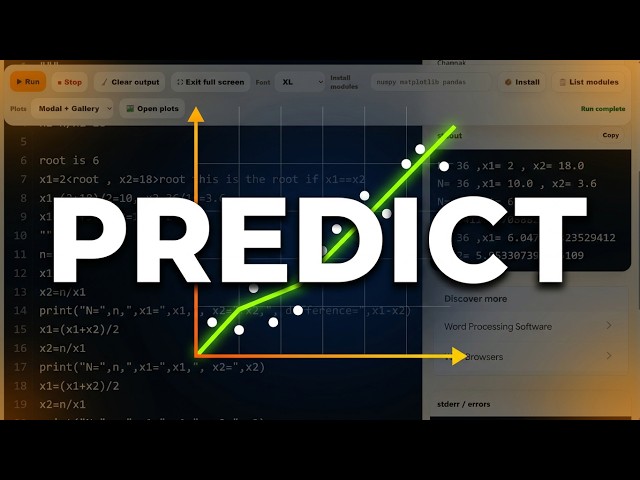
... इन Python के अंदर यहां पर हमारा प्रोग्राम है और यहां हमारा इसका आउटपुट ...
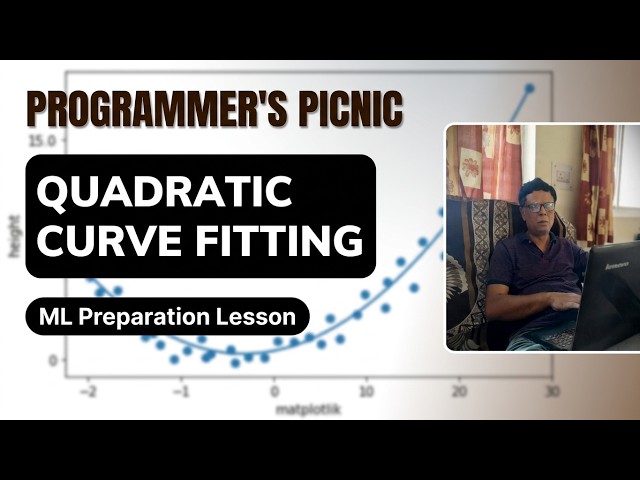
This is the 4th and last video in our preparation series before starting Machine Learning programming. Before we begin Machine ...
48 views
3 days ago
Separate two groups of bars in matplotlib Helpful? Please use the *Thanks* button above! Or, thank me via Patreon: ...
1 view
Starting Machine Learning programming. Learning Machine Learning, we must understand how data points can be used for ...
93 views
5 days ago
Description: This is the 4th and final video in our preparation series before starting Machine Learning programming. Before ...
137 views
7 days ago
41 views
1 day ago
Mathjax/Matplotlib font in Jupyter Helpful? Please use the *Thanks* button above! Or, thank me via Patreon: ...
27 views
Python : How to export a contourf to a 2D array? Helpful? Please use the *Thanks* button above! Or, thank me via Patreon: ...
Embedding pyplot graph into html on django framework Helpful? Please use the *Thanks* button above! Or, thank me via ...
2 views
4 days ago
Pandas Series Attributes - name , index.name , values , size , empty | Data Handling using Pandas #pythontutorial ...
4 views
Pandas Series Methods - Head() , Count() , Tail() | Data Handling using Pandas #pythontutorial #informaticspractices ...
2D Histogram normalized for probabilities Helpful? Please use the *Thanks* button above! Or, thank me via Patreon: ...
3 views
The Bars of my Histogram are not showing and are cut off Helpful? Please use the *Thanks* button above! Or, thank me via ...
Plot bar graph using the first column as x axe Helpful? Please use the *Thanks* button above! Or, thank me via Patreon: ...