Upload date
All time
Last hour
Today
This week
This month
This year
Type
All
Video
Channel
Playlist
Movie
Duration
Short (< 4 minutes)
Medium (4-20 minutes)
Long (> 20 minutes)
Sort by
Relevance
Rating
View count
Features
HD
Subtitles/CC
Creative Commons
3D
Live
4K
360°
VR180
HDR
16 results
Matplotlib is Python's most powerful data visualization library — and most tutorials only scratch the surface. This crash course ...
23 views
7 days ago
Course Description Welcome to the course **Python Programming: Fundamentals to Advanced Applications | AI | ML | DL. Python ...
112 views
3 days ago
Jupyter Notebook: Everything You Need to Know | Python | AI | ML | DL | Data Science** Welcome to this hands-on tutorial on ...
24 views
21 hours ago
Installation and Setup of Anaconda for Jupyter Notebook |Python | AI | ML | Data Science | Installation and Setup of Anaconda ...
33 views
1 day ago
What happens when five people use a simple prompt to ask AI for a snake game? They get five completely different games.
4 days ago
This is a project-based introduction to computational mechanics. There are five modules with exercises, homeworks, and final ...
20 views
Streamed 1 day ago
NYC Open Data Week - March 27 2026 NYC Residential Property Sale Insight: Model Improvement and AI Integration Chunhong ...
2 views
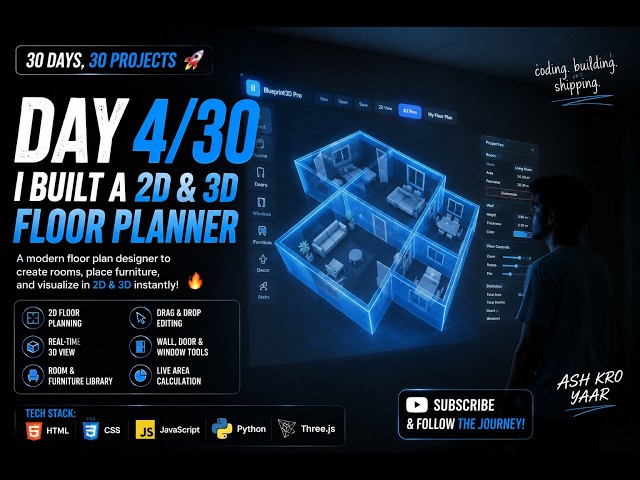
Day 4/30 of my challenge: Build 30 Projects in 30 Days! Today I built Blueprint3D Pro, a modern floor plan designer that allows ...
12 views
6 days ago
Discover why Asiya Parveen DigiAM for her Python Programming Course and how this training helped his build coding skills, ...
Discover why Arpit chose DigiAM for her Python Programming Course and how this training helped his build coding skills, ...
0 views
This short webinar gives a basic introduction on the HIDE-deconv command line tool for cellular deconvolution of bulk ...
13 views
Python for AI Explained | AI Internship 2026 Welcome to this session on Python for Artificial Intelligence! Python is the most ...
2 days ago
Data Science using Artificial Intelligence (AI) Notes: ...
10 views
1 view
AI, Machine Learning, Deep Learning & Data Science – Complete Overview Welcome to this comprehensive introductory session ...