Upload date
All time
Last hour
Today
This week
This month
This year
Type
All
Video
Channel
Playlist
Movie
Duration
Short (< 4 minutes)
Medium (4-20 minutes)
Long (> 20 minutes)
Sort by
Relevance
Rating
View count
Features
HD
Subtitles/CC
Creative Commons
3D
Live
4K
360°
VR180
HDR
4,342 results
If you're still using console.log() to find and fix JavaScript issues, you might be spending more time debugging than you need to.
900,086 views
8 years ago
Learn how to use the most popular Chrome DevTools features related to inspecting network activity, including: 1:05 - View a ...
395,766 views
6 years ago
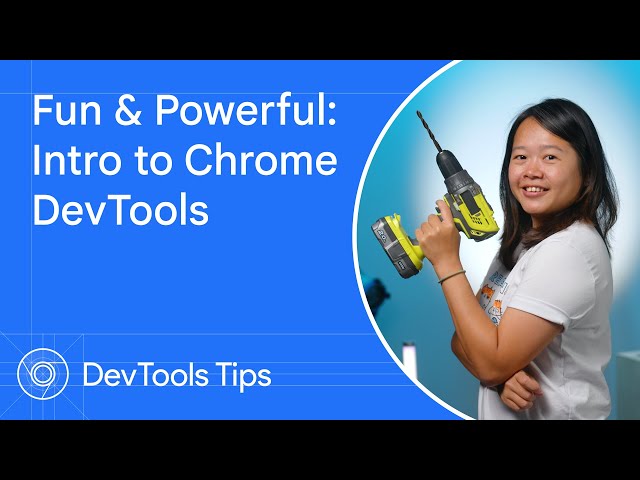
Jecelyn walks you through the basics of getting started and tips for Chrome DevTools. Watch more DevTools Tips ...
21,431 views
1 year ago
Never lose your place in the Performance panel timeline again. Zoom in and set a breadcrumb to clamp the boundaries of the ...
7,349 views
Baseline is now available in DevTools! Learn how this update allows developers to know if a property has limited availability, ...
73,838,868 views
2 months ago
Test UI changes and production fixes with the powerful network response overrides in Chrome DevTools. Learn to override and ...
13,491 views
When your teammate's asleep but the code's gotta be fixed! Check out how AI Assistance can help you debug CSS and style ...
9,980,544 views
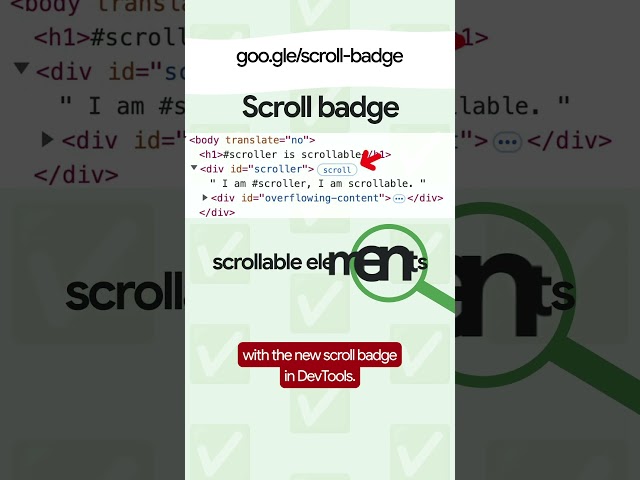
No more searching for scrollable elements. Now with the scroll badge in DevTools, you'll find them instantly! To learn more, visit ...
1,955 views
11 months ago
In this video, Jecelyn will walk you through the basics of getting started and tips for Chrome DevTools. Chapters: 0:00 ...
108,884 views
Barry joins Jecelyn again to explain how to record a trace in the Performance panel and debug LCP and CLS issues using the ...
28,750 views
Want to test your websites on different mobile devices without owning a real one? In this episode, Jecelyn walks you through 5 ...
122,171 views
3 years ago
Tired of manually copying your CSS fixes from DevTools to your local code? Connect your workspace to DevTools by ...
5,878 views
6 months ago
Learn what Time to First Byte (TTFB) measures. Debug TTFB with Performance Insights in the updated Chrome DevTools ...
37,898,837 views
3 months ago
Learn what Interaction to Next Paint (INP) measures. Debug INP with Performance Insights in the updated Chrome DevTools ...
45,338,028 views
Arrr! Stop chasing disappearing UI! Explore focus emulation and other advanced debugging techniques in Pixel Pirate, ...
2,832 views
5 months ago
This is short video demo on using developer tools in major web browsers including IE, FireFox, and Chrome. More from ...
805 views
13 years ago
Chrome is not just a great browser for viewing websites, but also an invaluable tool for building websites. Out of the box, Chrome ...
497 views
Test UI changes and production fixes with the powerful network response overrides in Chrome DevTools. Mock response headers ...
77,482 views
This video discusses two suggested web developer browser tools that every web designer should have in their arsenal as they ...
169 views
By far the best tool for a real internet explorer is the developer toolkit built in to modern browsers. It will reveal an enormous ...
981 views
9 years ago