Upload date
All time
Last hour
Today
This week
This month
This year
Type
All
Video
Channel
Playlist
Movie
Duration
Short (< 4 minutes)
Medium (4-20 minutes)
Long (> 20 minutes)
Sort by
Relevance
Rating
View count
Features
HD
Subtitles/CC
Creative Commons
3D
Live
4K
360°
VR180
HDR
7,485 results
Example of an animation with various subplots and axes using Python and Matplotlib.
21,705 views
13 years ago
Take my Full Python Course Here: https://www.analystbuilder.com/courses/pandas-for-data-analysis In this series we will be ...
123,963 views
3 years ago
Strengthen your skills in algorithmics and graph theory, and gain experience in programming in Python along the way. To follow ...
8,398 views
7 years ago
8,204 views
2,679 views
2,737 views
3,658 views
Welcome to this Python project tutorial where we dive into the fascinating world of data visualization! In this video, we will guide ...
6 views
3,745 views
3,290 views
3,198 views
1,972 views
1,991 views
Learn about Data Visualization fundamentals in Python using Matplotlib and Numpy Seaborn Heatmap Tutorial | Python Data ...
258 views
Graphillion is a Python module to efficiently manipulate a number of, even x-illions of, graphs for heavy graph problems like ...
1,087 views
Streamed 12 years ago
"Graph Databases: Talking about your Data Relationships with Python [EuroPython 2017 - Talk - 2017-07-14 - PyCharm Room] ...
901 views
8 years ago
One of the simplest ways to programmatically generate graph visuals is GraphViz. This video explains the basics of GraphViz ...
75,387 views
5 years ago
Montreal, November 11, 2013 -- Using Plotly and iPython for Scientific Graphing by Chris Parmer from Plotly. Source of the ...
33,916 views
12 years ago
5,103 views
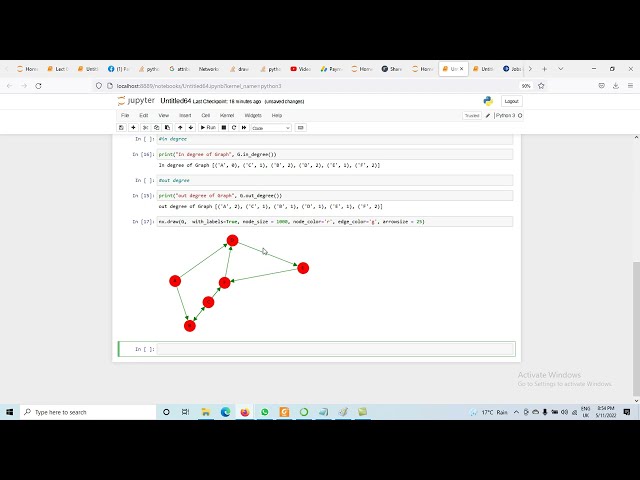
Graphs with networkx Python networkx library A simple undirected graph (or simply, a graph) G is defined as G=(V,E) , where ...
1,768 views
4 years ago
4,780 views
Overview of lesson covering visualization with pandas and Matplotlib.
41 views
3,002 views
... tamil python course python for beginners python full course python graphing python libraries for data science python matplotlib ...
60 views
In this video, we'll explore the powerful combination of Python's Pandas library and igraph for data visualization. If you're looking ...
50 views
1 year ago
3,890 views
1,915 views
The ZODB is an object-oriented database written in Python and optimized in C. Just subclass off of class Persistent Object, and ...
826 views
2,233 views
250,358 views
In this video, I am using https://infranodus.com to generate a knowledge graph using LLM. I will show you how you can build a ...
12,605 views
Lect 03: Multi Graphs with Networkx Types of Graph: i. Directed graphs, ii. Multigraphs iii. Weighted Graphs Multi Graphs G(V, ...
2,247 views
Aileen Nielsen https://2016.pygotham.org/talks/368/probabilistic-graphical-models-in-python This talk will give a high level ...
33,457 views
9 years ago
3,020 views
Composing AI Applications as a Graph with Haystack - Tuana Celik, deepset There are many moving parts in a fully functioning AI ...
465 views
2 years ago
Graph neural networks for information extraction with PyTorch [EuroPython 2021 - Talk - 2021-07-30 - Parrot [Data Science]] ...
1,504 views
In this video, we'll explore how to visualize data effectively by plotting two lists on a single graph using Python. You'll learn how to ...
10 views
10 months ago
PyCon Thailand: https://2018.th.pycon.org/ Graph-Theoretic Computation in Python Speaker: Poomjai Nacaskul, PhD, DIC, CFA ...
264 views
Join the community → https://www.systemsinnovation.network/spaces/20867260/page Find the complete set of Si Toolkit here ...
184,956 views
11 years ago
Learn how to find the square root of a number in Python without directly using sqrt(). In this video, we build the logic step by step ...
1 month ago
Lect 02: Types of Graphs with Networkx ||Directed Graph using Python Types of Graphs with Networkx i. Directed graphs, ii.
3,303 views
https://amzn.to/4aLHbLD You're literally one click away from a better setup — grab it now! As an Amazon Associate I earn ...
0 views
2,870 views
by Vincent Cave At: FOSDEM 2020 https://video.fosdem.org/2020/AW1.121/graph_python_scalable_graph_processing.webm ...
159 views
Data Science Mentorship Program (DSMP) 2022-23 Enroll in this Programme from our Website - https://learnwith.campusx.in/ ...
139,395 views
Streamed 3 years ago
Introductions to Epetra Matrices, Graphs & Extensions in the context of PyTrilinos Full Course at: ...
1,037 views
In this video, I dive into the exciting world of knowledge graph generation and how it can be adapted to different texts. I showcase ...
757 views
583,610 views
In this video, we delve into the intricacies of Matplotlib, a powerful plotting library in Python. If you've ever encountered issues with ...
8 views
3 views
he ZODB is a mature graph database written in Python and optimized in C. Just subclass off of class Persistent Object, and ...
460 views
Veusz is Open Source Free software used for scientific plotting and graphing. Python is also Open Source Free software and I ...
4,227 views
Random Walk on Graph using networkx Github link: ...
3,069 views
Social Network Analysis - From Graph Theory to Applications with Python - Dima Goldenberg - PyCon Israel 2019 Social network ...
34,129 views
For more math, subscribe to my channel: https://www.youtube.com/jeffsuzuki1.
373 views
Today's Topic: How to control width of graph line in matplotlib? Thanks for taking the time to learn more. In this video I'll go through ...
4 months ago
Join us: https://discord.gg/sZkePhaWSZ --- The speaker shares their experience with programming interviews, discussing specific ...
81 views
PyCon Taiwan 2021|一般演講 Talks 摘要 Abstract Remember how many times you look up “how to do this in pandas”?
482 views
Today's Topic: How to store a networkx graph for visualizing in Gephi? Thanks for taking the time to learn more. In this video I'll go ...
5 views
3 months ago
73 views
I write a Python program to generate graph paper with coordinate axes on it, to use as a background layer when I use my graphics ...
953 views
6 years ago
Learn Line Plot in Python (Matplotlib) | Complete Beginner to Advanced Guide In this video, you will learn how to create and ...
24 views
We are creating a visualization series with Python programming language and the lesson shared in this video is part of that series.
150 views
Andreas Dewes - Code is not text! How graph technologies can help us to understand our code better. [EuroPython 2015] [21 July ...
875 views
10 years ago
This video focuses on the low-level graph_objects interface of plotly, with some recipes to add additional interactive features such ...
23 views
5 months ago
This video follows on from sessions 8A and 8B. In this session we explore the visualisation of network graph data using NetworkX ...
240 views
2 views
Slides: https://doi.org/10.5281/zenodo.2553471 Workshop: https://www.appliedmldays.org/tracks/12 References: Python library: ...
371 views
3,479 views
Chris Kamphuis and Arjen de Vries. "GeeseDB: A Python Graph Engine for Exploration and Search" in Proc. of the Second ...
37 views
22 views
20 views
import matplotlib.pyplot as plt → Imports Matplotlib plotting module. plt.plot(x, y) → Draws a line graph. plt.title() → Adds a graph ...
17 views
2 weeks ago
Here we go with the series on plotting in python. Matplotlib is a well-known library used for plotting purposes. The series is made ...
74 views
Matplotlib intro Python lab how to draw 2D 3D graphs.
49 views
SuperQuick (tm) intro to making a graph in VPython (glowscript VPython).
5,927 views
centumacademy, #manim #python GRAPHS OF ALL STANDARD FUNCTION in just ONE MINUTE !!
1,144 views
In this video, we'll explore the powerful capabilities of the Pandas library in Python, specifically focusing on how to visualize ...
7 months ago
This video is part of our FREE Data Science tutorial using Python and Pandas: ...
1,818 views
This talk was presented at PyCon India 2019, on Oct 12th - 13th, at the Chennai Trade Centre. Website: https://in.pycon.org/2019.
125 views
In this video, we delve into the intricacies of building TensorFlow graphs within functions, a powerful technique that enhances ...
In this video, we'll explore the essential techniques for sorting the X-axis in Matplotlib, a powerful plotting library in Python.
54 views
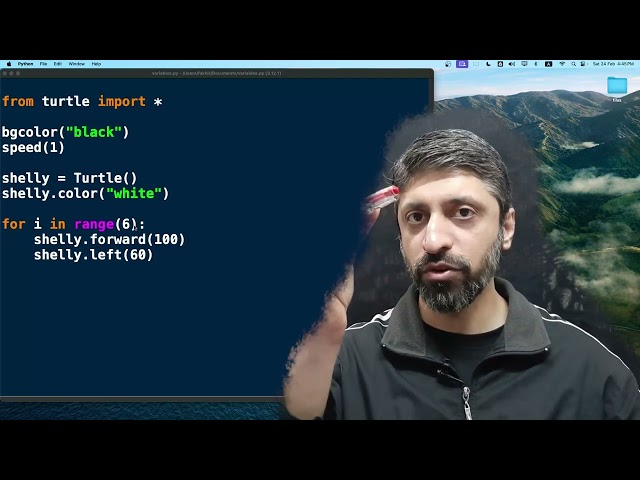
In this video we draw some very basic shapes in turtle graphics such as square, hexagon, circle etc.
211 views
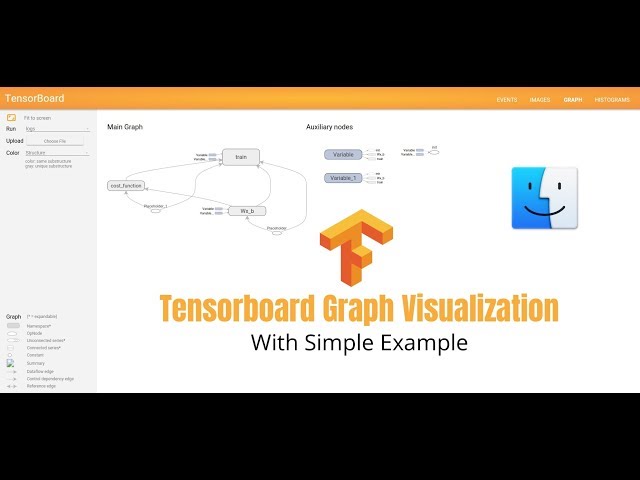
Tensorflow Visualize Computational Graph to Add Two Numbers using Tensorboard display image Visualizing TensorFlow ...
1,098 views
Download Excel VBA MIS Learning - App - https://play.google.com/store/apps/details?id=co.hodor.jqijz iOS - https://apps ...
59 views
Speaker: Mosky Liu 現實中有許多有網絡關係的資料--- 例如網際網路上的網頁與超連結、Facebook 上的人與朋友關係、購物網站中 ...
7,350 views
In this video, we'll explore how to customize the position of XTick labels in Python's Matplotlib library. Whether you're creating ...
19 views
https://media.ccc.de/v/12-gnome_games_graph_based_health_analytics An extension of gnome-continuous. A graph based ...
432 views
PyCon Taiwan 2021|專業課程 Tutorials 投影片 Slides:https://terminusdb.com/blog/ 摘要 Abstract Storing data in a ...
296 views