ViewTube

ViewTube
Sign inSign upSubscriptions
Filters

Upload date

Type

Duration

Sort by

Features

Reset

600 results

Code&ScriptLab
¡DEJA de hacer gráficos feos en Python! 🚫 Matplotlib Funcional desde Cero

Sigues creando gráficos básicos y sin vida en Python? En este tutorial completo vas a aprender a dominar Matplotlib utilizando el ...

18:38
¡DEJA de hacer gráficos feos en Python! 🚫 Matplotlib Funcional desde Cero

2 views

1 hour ago

Jakubication
How To Install matplotlib in Python 3.14.6

This video shows how to install matplotlib on Python 3.14.6 It will walk you through, step-by-step, how to install matplotlib on ...

2:43
How To Install matplotlib in Python 3.14.6

2 views

16 hours ago

Simplilearn
Applied Data Science With Python Full Course 2026 [Free] | Python For Data Science | Simplilearn

Data Scientist Masters Program (Discount - YTBE15) ...

7:36:29
Applied Data Science With Python Full Course 2026 [Free] | Python For Data Science | Simplilearn

1,351 views

Streamed 1 day ago

yesh
Matplotlib Pyplot Tutorials - Python and Data Science Visualization
54:53
Matplotlib Pyplot Tutorials - Python and Data Science Visualization

7 views

6 days ago

Enrique Barros
Express Data Visualization with Seaborn, Matplotlib, and Pandas

💻🅃🄷🄴 🄿🄲 🄼🄰🅂🅃🄴🅁💻 📚 Practice exercises: https://github.com/enrique-barros/pandas-exercises/ 🌐 My GitHub: https://www.github ...

2:38
Express Data Visualization with Seaborn, Matplotlib, and Pandas

3 views

3 hours ago

Datascience Monster
Hands-On Data Visualization in Python | Matplotlib & Seaborn for Beginners

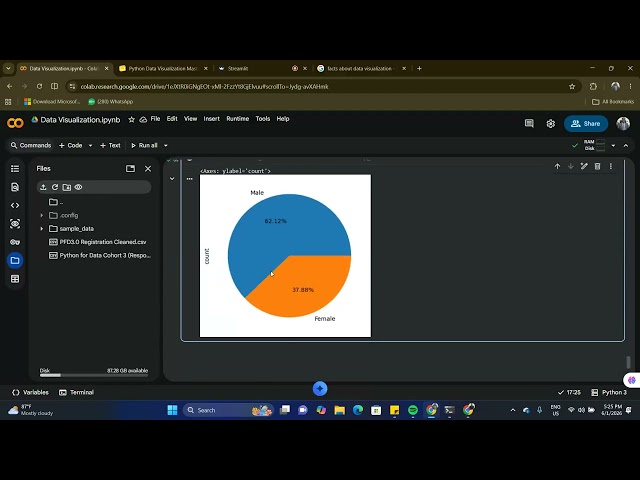
In this hands-on Python data visualization tutorial, you will learn how to create powerful charts and graphs using Matplotlib and ...

19:43
Hands-On Data Visualization in Python | Matplotlib & Seaborn for Beginners

21 views

3 days ago

Careertronicglobal
Python Data Analysis Visualization | Bar Chart, Pie Chart, Histogram 📊| #python #education #data #fy

Learn Data Visualization in Python with practical examples! In this video, you'll learn how to create and customize different types ...

14:36
Python Data Analysis Visualization | Bar Chart, Pie Chart, Histogram 📊| #python #education #data #fy

0 views

13 hours ago

MannieLytics Data Science Academy
Ep. 1: Data Visualization with Python - Pie Charts (Matplotlib and Plotly)
24:26
Ep. 1: Data Visualization with Python - Pie Charts (Matplotlib and Plotly)

5 views

56 minutes ago

하얀설표
V.3 Seolpyo MPLchart(python fast candlestick chart)

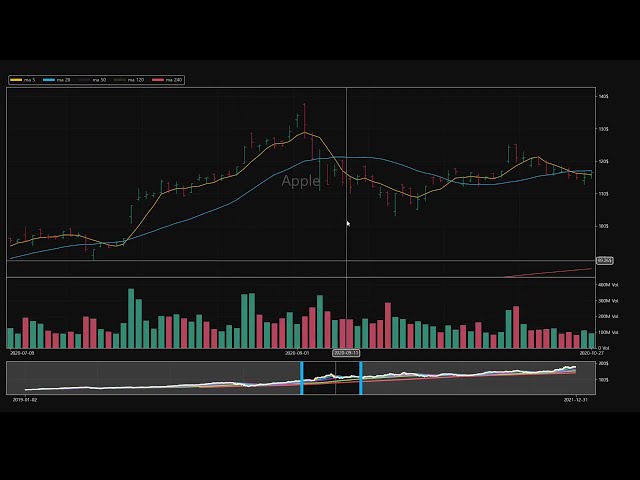
python matplotlib + tkinter candlestick chart version 3.

1:44
V.3 Seolpyo MPLchart(python fast candlestick chart)

1 view

7 days ago

Dev w/Sel
Learning Data Science, ML & AI | Part 2: Visualizing Data with Matplotlib

I'm learning Data Science, Machine Learning, and AI step by step, and I'm turning the process into a video series. In Part 2, I ...

53:17
Learning Data Science, ML & AI | Part 2: Visualizing Data with Matplotlib

31 views

7 days ago

Teensy Step to Project
​💻 Turn Any Image into a Pencil Sketch with Python! | Image Processing Tutorial 🚀

Want to learn how image filters work under the hood? ​In this video, we take a Teensy Step into Image Processing! 🖼️ We ...

6:25
​💻 Turn Any Image into a Pencil Sketch with Python! | Image Processing Tutorial 🚀

25 views

4 days ago

Roel Van de Paar
Adding text into bar-chart graph in Matplotlib (Python)

Adding text into bar-chart graph in Matplotlib (Python) Helpful? Please use the *Thanks* button above! Or, thank me via Patreon: ...

3:00
Adding text into bar-chart graph in Matplotlib (Python)

8 views

3 days ago

Marco Campolo
Coding a Smooth Mandelbrot Zoom in Python (Part 1)

n this video, I'll show you how to write a Python script that generates a stunning, smooth-shaded zoom animation straight into the ...

15:34
Coding a Smooth Mandelbrot Zoom in Python (Part 1)

1 view

4 days ago

Farjana Munmun
Visualizing data with matplotlib and python
8:32
Visualizing data with matplotlib and python

15 views

5 days ago

Simplilearn
Applied Data Science With Python Full Course 2026 [Free] | Python For Data Science | Simplilearn

Data Scientist Masters Program (Discount - YTBE15) ...

7:36:59
Applied Data Science With Python Full Course 2026 [Free] | Python For Data Science | Simplilearn

947 views

Streamed 1 day ago

Simplilearn
Applied Data Science With Python Full Course 2026 | Learn Data Science With Python | Simplilearn

Data Science Course ...

7:36:17
Applied Data Science With Python Full Course 2026 | Learn Data Science With Python | Simplilearn

2,901 views

4 days ago

Simplilearn
AI With Python Full Course 2026 [FREE] | Learn Artificial Intelligence With Python | Simplilearn

Microsoft AI Engineer Program ...

6:24:59
AI With Python Full Course 2026 [FREE] | Learn Artificial Intelligence With Python | Simplilearn

2,462 views

Streamed 20 hours ago

MannieLytics Data Science Academy
Ep.3: Data Visualization with Python - Line Plots (matplotlib, seaborn, plotly)
19:14
Ep.3: Data Visualization with Python - Line Plots (matplotlib, seaborn, plotly)

10 views

56 minutes ago

The Coder Abhi
Matplotlib Markers Explained 🚀 | Line Style, Color & Width | Python Hindi | Day - 2

Matplotlib Markers Explained | Line Style, Color & Width | Python Hindi | Day - 2 In this Matplotlib Day 2 tutorial, we learn how to ...

9:12
Matplotlib Markers Explained 🚀 | Line Style, Color & Width | Python Hindi | Day - 2

6 views

1 hour ago

RR Consultancy Assignment Guidance
Multiple-Variables with BubbleCharts in Python Tutorial #python #datascience #education #programming

Mastering Data Visualisation:Plotting Multiple Variables with Bubble Charts in Python! Website: ...

2:07
Multiple-Variables with BubbleCharts in Python Tutorial #python #datascience #education #programming

0 views

1 day ago