Upload date
All time
Last hour
Today
This week
This month
This year
Type
All
Video
Channel
Playlist
Movie
Duration
Short (< 4 minutes)
Medium (4-20 minutes)
Long (> 20 minutes)
Sort by
Relevance
Rating
View count
Features
HD
Subtitles/CC
Creative Commons
3D
Live
4K
360°
VR180
HDR
172 results
And the purpose that I typically create visualizations for is data analysis. So I'm going to talk a little bit about kind of the idea of ...
14,893 views
8 years ago
Welcome to exploratory data analysis and data visualization. Before we get into the actual subject matter of the course, some ...
107 views
6 years ago
Statistics for Experimentalists by Dr. A. Kannan,Department of Chemical Engineering,IIT Madras.For more details on NPTEL visit ...
2,008 views
10 years ago
Week 4: Tutorial 04 Part 01: Plotting In 1 D Using Python.
1,171 views
3 years ago
A programming workshop we ran at the University of Bristol covering our Introduction to Data Analysis in Python course on the 3rd ...
14,006 views
5 years ago
This lets you have a, for example, a workflow where you might preprocess, filter, do initial exploratory data analysis using tidy data ...
6,531 views
Learn Data Science is this full tutorial course for absolute beginners. Data science is considered the "sexiest job of the 21st ...
4,308,844 views
4,342 views
All of us deal with data. A lot of us do data science. And yet only some of us get a chance to really infuse science into that data ...
122 views
4 years ago
You can use this data visualization to do that. So it adds on to just the statistical analysis. It allows you to answer questions that ...
705 views
Why don't we teach data cleaning? It has been said that it is difficult to generalize: that what we learn from cleaning Medicare data ...
1,188 views
In a sense the exploratory data analysis is like you know "let the data speak for themselves approach" to uncover the underlying ...
980 views
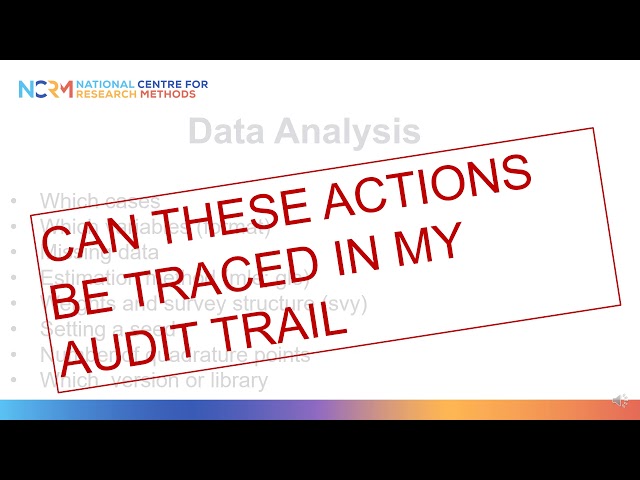
This 28-minute video introduces the concept of the data analysis workflow. The focus of this video is social science research that ...
1,720 views
NYC School of Data 2024 - March 23, 2024 29 Don't Fear The Text: An introduction to text analysis and natural language ...
120 views
1 year ago
Video explains about how to explore datasets using Pandas and Python. for code, Github link: ...
131 views
Let's dive into data analysis techniques to extract meaningful insights. Exploratory data analysis is like detective work. Uncover ...
118 views
This tutorial delves into the foundational tools (e.g., Matplotlib, Seaborn, Pandas)for data visualization in Python. We'll explore bar ...
599 views
2 years ago
Summary - Seaborn makes it easy to generate plots useful for EDA - relplot() is used for visualizing relationships between two ...
790 views
Presented by David Christensen. This video is part of a series of lectures recorded to teach about basic data visualization ...
303 views
Exploratory graphics are the single best method – the quickest and the most informative – to get a grasp on your data. For more on ...
2,187 views