Upload date
All time
Last hour
Today
This week
This month
This year
Type
All
Video
Channel
Playlist
Movie
Duration
Short (< 4 minutes)
Medium (4-20 minutes)
Long (> 20 minutes)
Sort by
Relevance
Rating
View count
Features
HD
Subtitles/CC
Creative Commons
3D
Live
4K
360°
VR180
HDR
600 results
This video shows how to install matplotlib on Python 3.14.5 It will walk you through, step-by-step, how to install matplotlib on ...
60 views
3 weeks ago
Python Line Plot Tutorial for Beginners | Matplotlib Step by Step Guide In this video, you will learn how to create a simple line chart ...
16 views
This video shows how to install matplotlib on Python 3.14.6 It will walk you through, step-by-step, how to install matplotlib on ...
1 view
7 hours ago
How To Install Matplotlib in Python on Windows 11 (Fix pip install & Setup Guide) If Matplotlib isn't working or won't install, ...
24 views
2 weeks ago
Matplotlib is the grandfather of Python data visualization. Created by John D. Hunter in 2002, it powers virtually every data science ...
12 views
Create Beautiful Area Charts with Python & Matplotlib Learn how to create a beautiful Area Chart in Python using Matplotlib!
14 views
Create Stunning Pie Charts in Python | Matplotlib Step-by-Step Tutorial Learn how to create beautiful Pie Charts in Python ...
28 views
3 views
How to Create a Radar Chart in Python | Matplotlib Tutorial for Beginners In this video, you'll learn how to create a Radar Chart ...
30 views
Mastering data visualization is a core requirement for any engineering student, GATE DA aspirant, or aspiring data scientist.
10 views
5 views
Learn the fundamentals of Python for Spatial Analysis and discover how to visualize satellite imagery bands for Remote Sensing ...
112 views
Welcome back to the Avadh Tutor Data Science series! You have loaded and cleaned your data, but looking at endless rows of ...
22 views
1 month ago
Contextily is a lightweight Python library that enhances geospatial visualizations by adding web-based basemaps to maps ...
0 views
5 hours ago
Reynaldo Zeballos.
9 views
3 days ago
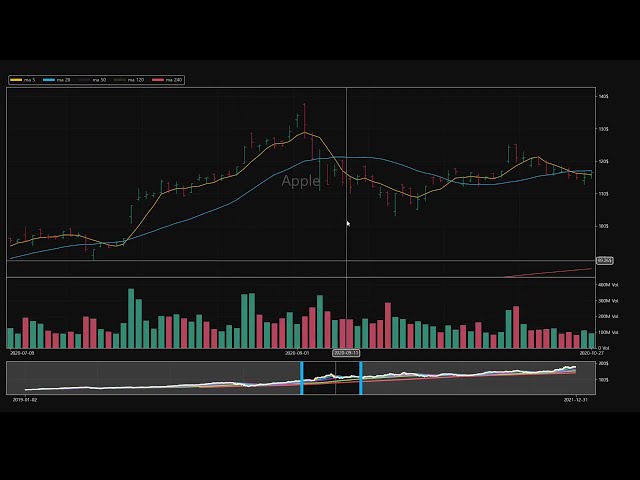
python matplotlib + tkinter candlestick chart version 3.
7 days ago
Adding text into bar-chart graph in Matplotlib (Python) Helpful? Please use the *Thanks* button above! Or, thank me via Patreon: ...
8 views
This project presents a real-time 3D simulation engine for UAV swarms, developed in Python using matplotlib. It demonstrates a ...
29 views