Upload date
All time
Last hour
Today
This week
This month
This year
Type
All
Video
Channel
Playlist
Movie
Duration
Short (< 4 minutes)
Medium (4-20 minutes)
Long (> 20 minutes)
Sort by
Relevance
Rating
View count
Features
HD
Subtitles/CC
Creative Commons
3D
Live
4K
360°
VR180
HDR
81,682 results
http://goo.gl/e65TCX for more FREE video tutorials covering MATLAB Programming This video briefly illustrates how to get 2d ...
5,190 views
10 years ago
... of X Okay And next I'm going to plot x versus y by 3 And I'm using a color green And the style should be dash dot And I'm setting ...
188 views
8 months ago
123 views
I hope this will be helpful for you :)
128,836 views
8 years ago
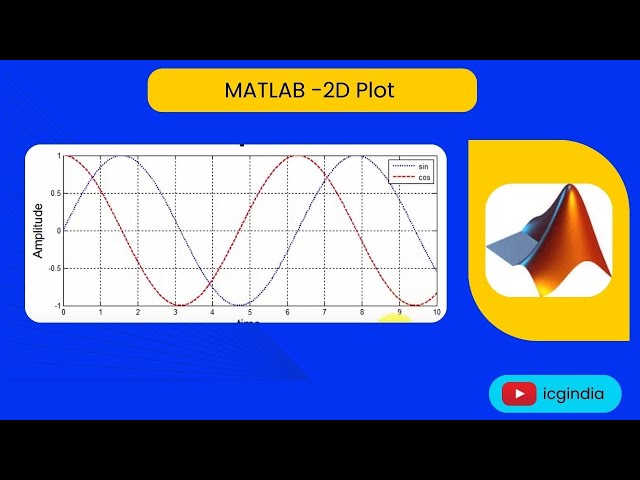
This video lets you know about 2d and 3d plots in matlab.For more info visit https://www.matlabsolutions.com/
401 views
4 years ago
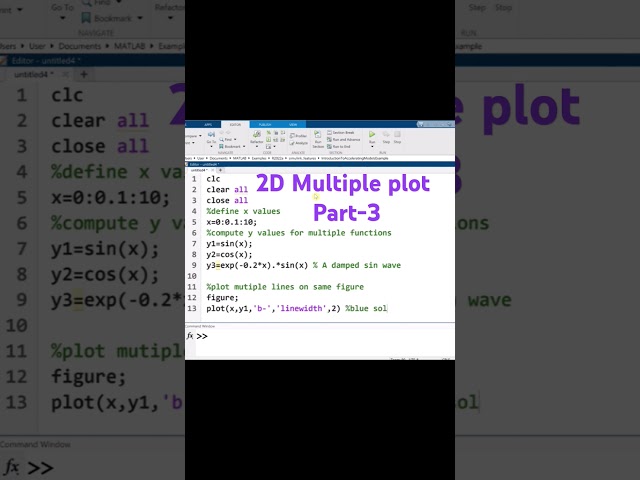
So I am going to write figure that open a new figure window Then I'm going to plot X versus Y1 and color should be blue with style ...
103 views
How to Make a 2D Scatter Plot in MATLAB! Change datapoint size and color, in addition to plotting on the x and y axis.
9,035 views
3 years ago
In this video we have explained to creates a 2-D line plot of the data in Y versus the corresponding values in X. For more info ...
126 views
Okay so next I am going to add label title and legend because we are using we are play plotting a pre major functions so for that ...
234 views
MATLAB TUTORIALS.! 2D plotting.
43 views
7 years ago
2-D Data plotting in MATLAB (basic plot and importing data from Excel to plot using Matlab)
144 views
Learn how to use tiledlayout to create subplots in MATLAB. tiledlayout creates a tiled chart layout for displaying multiple plots in ...
28,523 views
5 years ago
In this easy-to-follow video, we show you how to create a simple line plot and label the axes. Customize the appearance of plotted ...
56 views
2 years ago
Learn how to create and interact with plots in MATLAB®, which is an important part of creating MATLAB code. Anyone – from ...
44,976 views
6 years ago
Get instant access to Project files ...
469,058 views
7 months ago
In this guide, we will explore how to visualize a NxM matrix from sensor data in MATLAB, creating a colorful 2D plot to effectively ...
10 views
In this video, i will explain how to plot a graph in MATLAB.
963 views
Matlab - How to plot 2d Quadratic equation Helpful? Please use the *Thanks* button above! Or, thank me via Patreon: ...
295 views