Upload date
All time
Last hour
Today
This week
This month
This year
Type
All
Video
Channel
Playlist
Movie
Duration
Short (< 4 minutes)
Medium (4-20 minutes)
Long (> 20 minutes)
Sort by
Relevance
Rating
View count
Features
HD
Subtitles/CC
Creative Commons
3D
Live
4K
360°
VR180
HDR
230 results
In python machine learning the Term Of Graphs refers to two entirely different concepts depending on your goal Data Visitation ...
0 views
13 days ago
Visualizing the fundamental graphs of algebra using Manim and Python! In this animation, we explore linear, quadratic, cubic, ...
25 views
1 month ago
Code Link: https://github.com/LearningSpaceHub/Scientific-Figure-Layout-Designer-for-Publication-Quality-Plots This tool helps ...
33 views
6 days ago
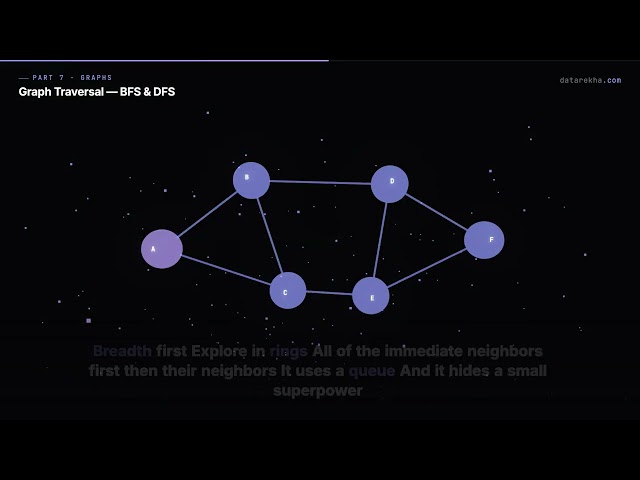
Graph Traversal — BFS vs DFS, Visually Explained Chapter 22 of 33 in Data Structures & Algorithms — The Complete Visual ...
3 views
Stop wasting time creating Minitab graphs manually! In this video, I'll demonstrate a Python-based automation workflow that ...
1 view
17 hours ago
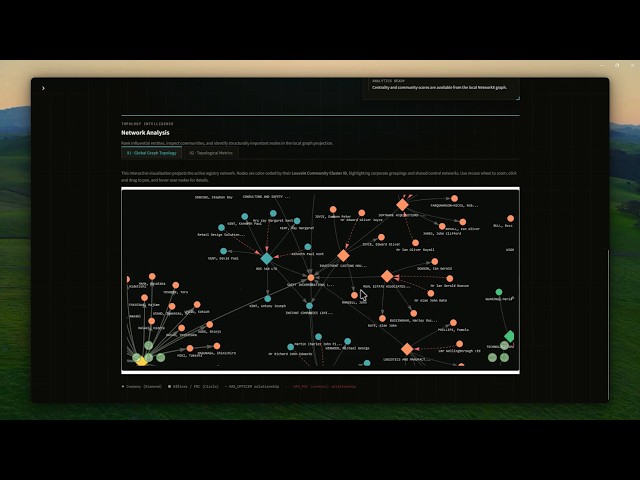
VEIL is a graph-native platform for exploring corporate ownership networks using live registry data. Built around the UK ...
2 weeks ago
Having trouble opening Origin Graph Data File? You're not alone! I'll show you how to open, view, and fix any OGL file on ...
Lecture 22 Title: Python Lecture 22 | Matplotlib Explained in Hindi | Data Visualization for Beginners Description: Python ...
3 weeks ago
Graphs for Machine Learning — From Networks to GNN Intuition Chapter 24 of 33 in Data Structures & Algorithms — The ...
5 views
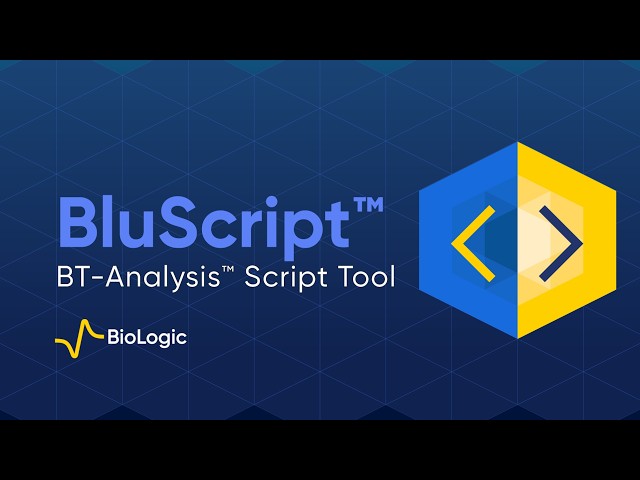
Break free from predefined tools. BluScript lets you run your own Python scripts directly within BT-Analysis™ to analyze and ...
74 views
Learn how to solve LeetCode Path Existence Queries in a Graph II using an efficient binary lifting approach. In this video, we ...
799 views
8 days ago
simulate mycelium growth as a graph network .Nodes spread with weighted probability, visually rendered in real time with ...
6 views
Graph Representations — Adjacency Lists, Matrices and Edges Chapter 21 of 33 in Data Structures & Algorithms — The ...
Get started with RAGU in just 2 minutes! In this short video, we walk you through the entire setup process — from installing the ...
45 views
How do AI models understand relationships between connected data? In this video, you'll learn Graph Neural Networks (GNNs)—a ...
50 views
Turn Python code into a beautiful tree! In this video, you'll learn how to draw a stunning tree using Python Turtle Graphics.
20 views
https://www.youtube.com/@Sfcfv?sub_confirmation=1 https://github.com/Singerwan/Manim.git.
18 views
This is a quick demo of "Scientific Pathfinder", an autonomous multi-agent research system designed to discover hidden research ...
Want to become a LangChain and LangGraph Engineer in 2026? In this video, I break down the complete learning ...
63 views
Python Lecture 21 | Data Visualization in Python Explained in Hindi In this lecture, we learn the basics of Data Visualization in ...
9 views