Upload date
All time
Last hour
Today
This week
This month
This year
Type
All
Video
Channel
Playlist
Movie
Duration
Short (< 4 minutes)
Medium (4-20 minutes)
Long (> 20 minutes)
Sort by
Relevance
Rating
View count
Features
HD
Subtitles/CC
Creative Commons
3D
Live
4K
360°
VR180
HDR
5,337 results
This video covers topics such as gain crossover frequency, phase crossover frequency, gain margin and phase margin. These are ...
21 views
1 year ago
Ever wondered if a Bode plot can really tell you if your control system is heading for disaster? This video dives into how these ...
0 views
3 weeks ago
Ever wondered how engineers ensure a control system doesn't go haywire? This video breaks down the powerful technique of ...
1 view
Ever wondered how engineers determine if a complex system will remain stable or spiral out of control? This video breaks down ...
Description.
3,348 views
11 years ago
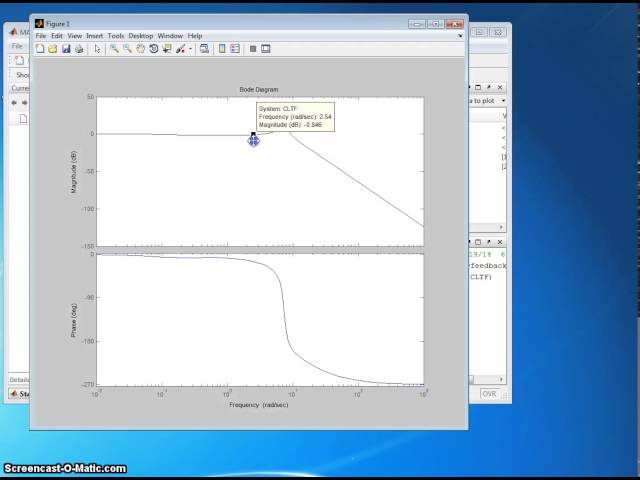
A motor, is an integrator. An Op-Amp, with feedback, acts as a motor, as shown on this graph. When this system is close-looped, ...
85 views
7 years ago
Ever wondered if Bode plots hold the key to understanding control system stability? This video dives deep into the power of these ...
Hello viewers today we are going to discuss about how to find the corner frequencies from the given transfer function from in the ...
17,454 views
2 years ago
How to calculate phase angle for given equation for different frequencies.
6,254 views
3 years ago
How to draw a bode plot.
463 views
A system has GS HS = K. S (S+2) ( S+4) (S+8) Draw the Root Locus plot.
20,172 views
53 views
15 years ago
Join this channel to get access to perks: https://www.youtube.com/channel/UCnTEznFhcHCrQnXSEatlrZw/join Click the link below ...
437 views
2 months ago
How Do Bode Plots Analyze Control System Stability? Have you ever wondered how engineers analyze the stability of control ...
3 views
This tutorial covers all the essential steps for visualizing frequency response in control systems. Perfect for beginners and ...
3,863 views
Bode Plot |Control System Experiment | LabVIEW he Magnitude plot is typically on the top, and the Phase plot is typically on the ...
3,351 views
8 years ago
27 views
MECE3350 Control System. Lecture 17, Exercise 104: Bode plots with complex poles. Lecture here: https://youtu.be/IZcb_TzaQQE ...
2,011 views
5 years ago
37 views
4 years ago
Drawing Bode Plots of a given Transfer Function (T.F.), computationally using the control package of GNU Octave.
1,780 views