Upload date
All time
Last hour
Today
This week
This month
This year
Type
All
Video
Channel
Playlist
Movie
Duration
Short (< 4 minutes)
Medium (4-20 minutes)
Long (> 20 minutes)
Sort by
Relevance
Rating
View count
Features
HD
Subtitles/CC
Creative Commons
3D
Live
4K
360°
VR180
HDR
3,538 results
This brief video illustrates how to use Bode magnitude and Bode phase plots through an exercise to approximate the response of ...
650 views
8 years ago
Hello viewers today we are going to discuss about how to write the expression for phase angle in Bode plot so this is our given ...
16,200 views
2 years ago
This video is a short tutorial on creating bode plots in Python. Support me on Patreon (if you want to) at ...
12,298 views
7 years ago
Bode plot approximations, drawing by hand, with and integrator.
9,156 views
15 years ago
Bode plots, frequency plots, gain-phase diagram, logarithmic axes, poles and zeros in bode plot by Arnold Knott, Technical ...
195 views
5 years ago
Description.
3,374 views
11 years ago
Visit http://ilectureonline.com for more math and science lectures! We will have a more detailed look at what the transfer function ...
45,383 views
6 years ago
... OUTLINE: 00:00:00 Mastering Bode Plots in 60 Seconds! frequency response analysis control system Bode Plot - Bode Plot is a ...
1,813 views
1 year ago
78 views
Join this channel to get access to perks: https://www.youtube.com/channel/UCnTEznFhcHCrQnXSEatlrZw/join Click the link below ...
724 views
4 months ago
343 views
Hello viewers today we are going to find the face crossover frequency and gain crossover frequency in Bode plot so as we all ...
6,796 views
Bode plot.
31 views
https://youtu.be/lDT5zjbut4A #gateexam #gate2023 #controlsystems #gate_preparation.
136,056 views
3 years ago
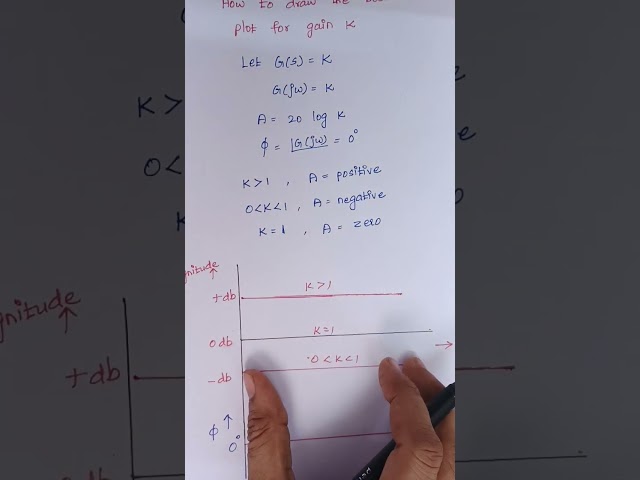
Hello viewers today we are going to see how to draw the Bode plot for a game K assume this is our problem G of s is equal to K so ...
5,854 views
MECE3350 Control System. Lecture 17, Exercise 104: Bode plots with complex poles. Lecture here: https://youtu.be/IZcb_TzaQQE ...
2,041 views
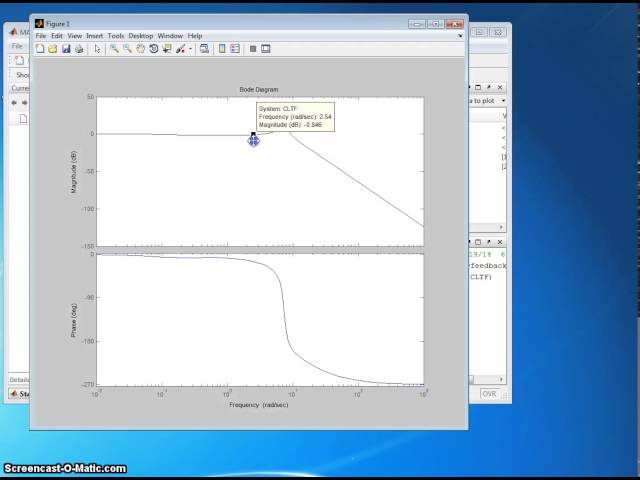
In this video learn how to use Control Systems Toolbox of matlab to bode diagram plot.
38 views
A system has GS HS = K. S (S+2) ( S+4) (S+8) Draw the Root Locus plot.
21,557 views