Upload date
All time
Last hour
Today
This week
This month
This year
Type
All
Video
Channel
Playlist
Movie
Duration
Short (< 4 minutes)
Medium (4-20 minutes)
Long (> 20 minutes)
Sort by
Relevance
Rating
View count
Features
HD
Subtitles/CC
Creative Commons
3D
Live
4K
360°
VR180
HDR
807 results
In this lesson, learn what is Matplotlib with its features. Matplotlib is an open-source plotting library developed by John D. Hunter.
24,456 views
2 years ago
In this video, we learn how to plot a scatter plot in Python programming language from scratch in matplotlib package. ➤ One of the ...
548 views
5 years ago
In this video, learn to download and install Python 3.14.3 on Windows 11. We will also run a sample Python code. Python Tutorial ...
150 views
9 hours ago
Find Complete Code at GeeksforGeeks Article: http://www.geeksforgeeks.org/graph-plotting-in-python-set-1/ This video is ...
9,606 views
8 years ago
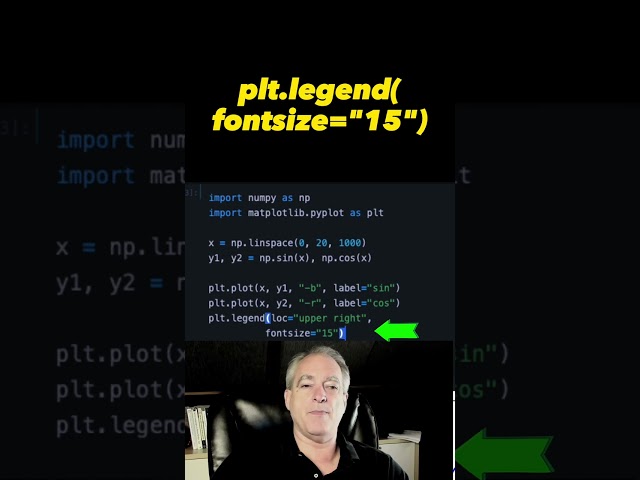
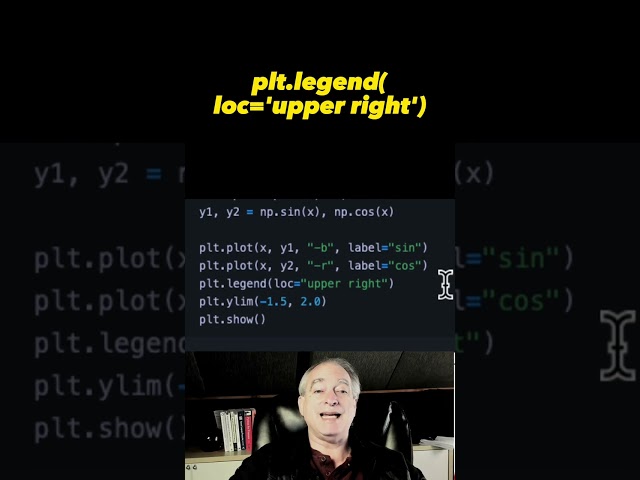
This video will show you how to control the Matplotlib legend size by controlling the font size used in the legend.
519 views
In this video, learn how to install matplotlib on Windows 10. We will also install Python 3 and pip. PIP is used to install and ...
11,701 views
It'll show streaming of data from API data and creating graph using matplotlib library. It's simple demo to understand way of ...
641 views
How can you actually fit data to a probability distribution in practice? Today, I provide a 60 second tutorial on how to do so in ...
21,950 views
Tutorial on plotting a bar chart (bar plot or bar graph) in matplotlib in Python programming language + example [from scratch in ...
877 views
Matplotlib python #short #tutorial - on basics of creating bar chart which is best suited for comparing categorical data.
239 views
The figure is the overall size that all subplots are drawn on. You can pass in figsize parameter when creating subplots to control ...
869 views
Matplotlib python #short #tutorial - on basics of creating a Stacked Bar Chart which is best suited for displaying multiple sets of ...
497 views
This video will show how to control what color each plot is when using Matplotlib.
522 views
Polars is a blazingly fast alternative to pandas for working with data in python. I couldn't believe the speed difference #python ...
349,692 views
3 years ago
In this video, I talk about: 1) How to import Matplotlib plotting library for Python Programming Language by calling 'import ...
284 views
This video is part of an online course, Intro to Data Science. Check out the course here: https://www.udacity.com/course/ud359.
1,658 views
10 years ago
In this quick video, we'll show you how to add a legend to a Matplotlib plot. This is a quick and easy way to improve the ...
246 views
Python #Matplotlib #Graph #2D_Plot #Points_Plot This video displays a way of plotting 2D points in a graph using Python and ...
1,285 views
In this video, learn how to download and install the Matplotlib library in Jupyter Notebook. Matplotlib Tutorial (English): ...
6,628 views
5 months ago
In this video, we are going to start from scratch and write a simple python program in command prompt. We will use the python ...
145,082 views