Upload date
All time
Last hour
Today
This week
This month
This year
Type
All
Video
Channel
Playlist
Movie
Duration
Short (< 4 minutes)
Medium (4-20 minutes)
Long (> 20 minutes)
Sort by
Relevance
Rating
View count
Features
HD
Subtitles/CC
Creative Commons
3D
Live
4K
360°
VR180
HDR
54 results
Master AI & LLMs – Fine-Tuning, RAG, DeepSeek, OpenAI & More! https://srpai.co/ Join my Udemy course for just ₹399/9$ ...
3 views
9 months ago
Use the axes to add titles to each subplot in Matplotlib.
280 views
2 years ago
The figure is the overall size that all subplots are drawn on. You can pass in figsize parameter when creating subplots to control ...
856 views
Welcome to Laplace Academy In this tutorial I draw multiple plot in a single figure. One of doing this is by using subplot command.
1,969 views
3 years ago
Title: Matplotlib: Figure Initialization: Size Auto-description: This video explains the procedure for initializing a figure ...
746 views
Title: Introduction to Matplotlib Auto-description: This video introduces Matplotlib, focusing on the importance of data ...
924 views
To remove the axis and ticks in matplotlib plots, you can use specific functions to disable them. Here's how you can achieve this: ...
178 views
1 year ago
Title: Matplotlib for Statistical Analysis Auto-description: This video introduces how to use Matplotlib for statistical ...
294 views
Title: Matplotlib: COVID-19 Healthcare Occupancy Auto-description: This video explains how to use Matplotlib to create ...
362 views
Título: Matplotlib: Ejemplo real, visualización de líneas Descripción automática: En este video se presenta un tutorial sobre la ...
286 views
It'll show streaming of data from API data and creating graph using matplotlib library. It's simple demo to understand way of ...
640 views
8 years ago
Title: Matplotlib: Multiple Series in a Line Chart Auto-description: This video explains how to represent multiple data ...
443 views
Title: Matplotlib: Bar Charts Auto-description: This video explains the use of bar charts in Matplotlib, highlighting their ...
388 views
Tutorial on rendering LaTeX equations to an image using Python and the Matplotlib module. The notebook can be found in the ...
1,007 views
11 months ago
Título: Matplotlib: Etiquetas: Título, ejes y leyendas Descripción automática: En este video, se explica cómo formatear etiquetas ...
2,615 views
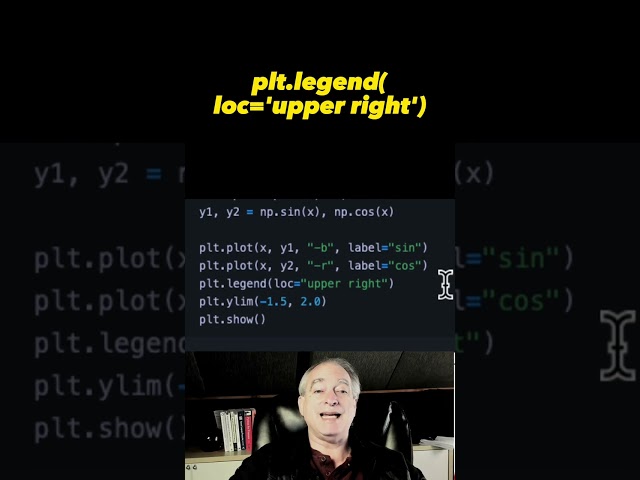
In this quick video, we'll show you how to add a legend to a Matplotlib plot. This is a quick and easy way to improve the ...
246 views
6 views
8 months ago
14 views
What does subplot mean? A spoken definition of subplot. Intro Sound: Typewriter - Tamskp Licensed under CC:BA 3.0 Outro ...
323 views
10 years ago
This video is part of the Udacity course "Machine Learning for Trading". Watch the full course at ...
23,260 views
9 years ago
7 views
9 views
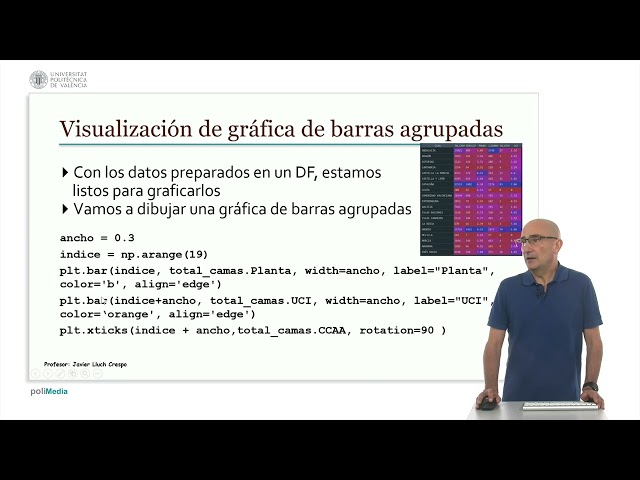
Title: Matplotlib: Real-life example, clustered bar chart visualization Auto-description: This video explains how to ...
467 views