Upload date
All time
Last hour
Today
This week
This month
This year
Type
All
Video
Channel
Playlist
Movie
Duration
Short (< 4 minutes)
Medium (4-20 minutes)
Long (> 20 minutes)
Sort by
Relevance
Rating
View count
Features
HD
Subtitles/CC
Creative Commons
3D
Live
4K
360°
VR180
HDR
106 results
Title: Introduction to Matplotlib Auto-description: This video introduces Matplotlib, focusing on the importance of data ...
935 views
3 years ago
This video shows how to install matplotlib on Python 3.13. It will walk you through, step-by-step, how to install matplotlib on Python ...
1,949 views
1 year ago
Title: Installing and Importing Matplotlib Self-description: This video explains the process of installing and using the ...
645 views
This video will show how to control what color each plot is when using Matplotlib.
520 views
2 years ago
The figure is the overall size that all subplots are drawn on. You can pass in figsize parameter when creating subplots to control ...
869 views
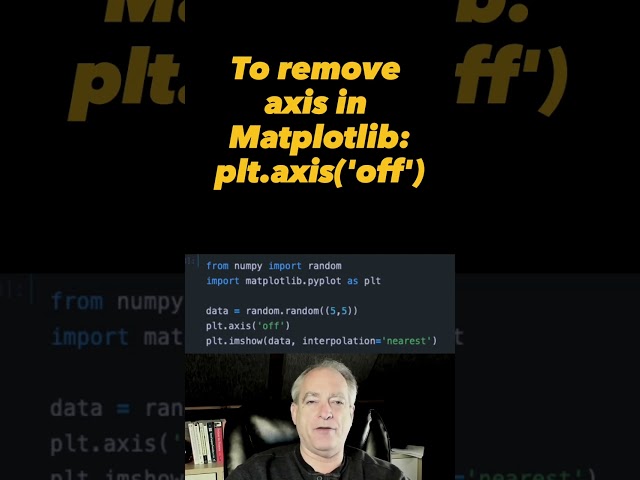
In this super short video, I show you how to remove the axis when plotting in Matplotlib. Useful for when your are plotting image ...
322 views
Title: Matplotlib: Figure Initialization: Size Auto-description: This video explains the procedure for initializing a figure ...
751 views
Let's learn how to install Matplotlib in PyCharm IDE. Matplotlib is a way of creating graphs and other data visualizations in Python.
73,531 views
4 years ago
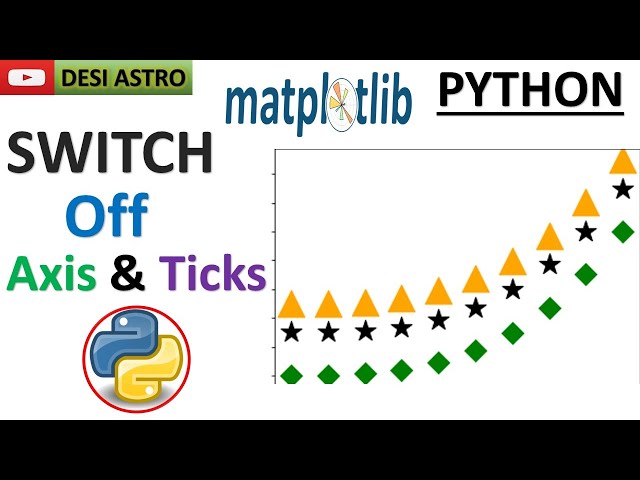
To remove the axis and ticks in matplotlib plots, you can use specific functions to disable them. Here's how you can achieve this: ...
178 views
In this lesson, learn what is Matplotlib with its features. Matplotlib is an open-source plotting library developed by John D. Hunter.
24,416 views
Python #Matplotlib #Graph #2D_Plot #Points_Plot This video displays a way of plotting 2D points in a graph using Python and ...
1,285 views
5 years ago
Hello Everyone! Today, in this video, I am going to step-by-step guide you on How to install Matplotlib with the latest Python 3.13 ...
1,174 views
5 months ago
Use plt.xticks() and plt.yticks() to specify which numbers have tick marks on your plots.
656 views
It'll show streaming of data from API data and creating graph using matplotlib library. It's simple demo to understand way of ...
641 views
8 years ago
Matplotlib python #short #tutorial - on basics of creating a Stacked Bar Chart which is best suited for displaying multiple sets of ...
497 views
Hang out to the end for the "one click" solution... More savefig options: ...
15,263 views
In this short video, I show you how to create a plot on a logarithmic axis in Matplotlib. You can grab the current axis with plt.gca().
507 views
In this video, learn how to install matplotlib on Windows 10. We will also install Python 3 and pip. PIP is used to install and ...
11,698 views
In order to control what range is shown on your Matplotlib plot, you have to grab the current axes using plt.gca(). Then use this ...
343 views
In this video, learn how to download and install the Matplotlib library in Jupyter Notebook. Matplotlib Tutorial (English): ...
6,458 views
In this video, I talk about: 1) How to import Matplotlib plotting library for Python Programming Language by calling 'import ...
283 views
This program simulates inertia and surface tension. I made this program in the early 2000s, it was a java applet. I made this ...
58 views
The hvplot library has a new .inspect() method that lets you interactively plot million- and billion-point datasets. Credit to Jean-Luc ...
1,231 views
Master AI & LLMs – Fine-Tuning, RAG, DeepSeek, OpenAI & More! https://srpai.co/ Join my Udemy course for just ₹399/9$ ...
14 views
9 months ago
Python #SVG #PNG #Matplotlib #Graph This video shows a way of exporting graph in SVG, PDF using Python and Matplotlib.
3,110 views


![How to Install Matplotlib with latest Python 3.13 on Windows 10/11 [ 2025 Update ] Complete Guide](/api/proxy/image?url=https%3A%2F%2Fi.ytimg.com%2Fvi%2FEw6QLDd20U0%2Fsddefault.jpg)