Upload date
All time
Last hour
Today
This week
This month
This year
Type
All
Video
Channel
Playlist
Movie
Duration
Short (< 4 minutes)
Medium (4-20 minutes)
Long (> 20 minutes)
Sort by
Relevance
Rating
View count
Features
HD
Subtitles/CC
Creative Commons
3D
Live
4K
360°
VR180
HDR
819 results
Learn how to visualize your data on the Databricks platform. Databricks can create detailed charts with a single click and also ...
23,842 views
9 years ago
1,049 views
2 months ago
In this video, you will learn how to use Databricks AI/BI and geospatial functions to analyze data based on proximity/distance and ...
590 views
1 month ago
AI/BI Dashboards is an AI-assisted experience for BI practitioners to quickly create analytical datasets, interactive dashboards, ...
6,586 views
1 year ago
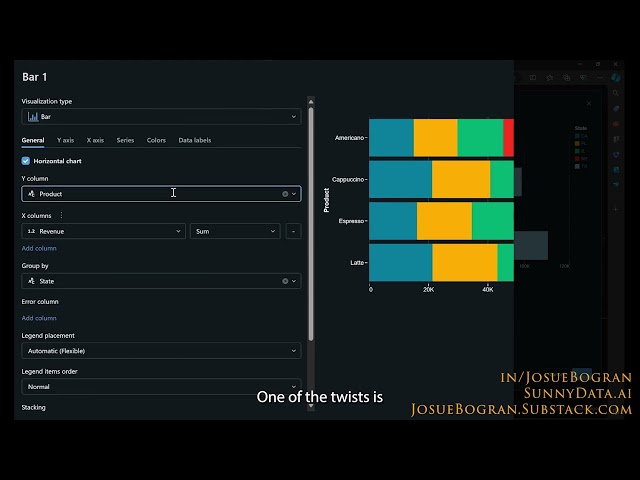
What you'll learn: → Create dashboards with AI Assistant → Generate visualizations from Notebook → Refine charts with natural ...
372 views
4 hours ago
Want to try it out? Check out this tutorial: https://docs.databricks.com/en/dashboards/create-a-dashboard.html.
4,530 views
This video provides an overview of Databricks AI BI, a tool designed to make analytics accessible to everyone. It features ...
3,736 views
4 months ago
This Data Exploration on Databricks jump start video will show you how go from data source to visualization in a few easy steps.
6,252 views
10 years ago
Databricks is used for building, testing, and deploying machine learning and analytics applications to help achieve better ...
3,884 views
2 years ago
Demonstration of the @Databricks' SQL Editor and its visualization capabilities for exploratory data analysis.
398 views
Discover how AI/BI Genie and Azure AI Foundry work together to revolutionize your data intelligence workflow. In this quick ...
3,409 views
5 months ago
Q1: How does Power BI integrate with Azure Synapse Analytics for big data reporting? Power BI connects to Azure Synapse ...
602 views
3 months ago
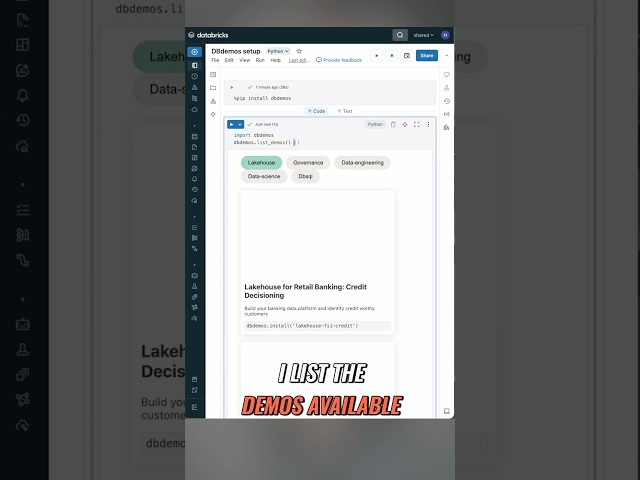
Check out the github here: https://github.com/databricks-demos/dbdemos.
5,050 views
41 views
Databricks and Power BI bring the advantages of Databricks Lakehouse performance and technology to all your users. Use the ...
31,866 views
3 years ago
3 AI Tools for Data Visualization Everyone Should Try #makemoneywithai Stop wasting hours on tasks that AI can handle in ...
127,588 views
Timbr's Graph Analyst brings AI-powered graph exploration directly into your Databricks environment - no coding required.
225 views
This is the EASIEST way to get your Databricks data on a map! 🗺️ Set up a demo here: ...
851 views
... the very basics of creating a very simple visualization do not understand what they're doing creating visualizations is the easiest ...
329,383 views
Get exam-ready with this detailed practice test for the Databricks Certified Data Analyst Associate exam! In this video, we go ...
104 views


![Introduction to Databricks - Part8 Data Visualization [Hands on Lab]](/api/proxy/image?url=https%3A%2F%2Fi.ytimg.com%2Fvi%2FVQFdWdWoQPs%2Fsddefault.jpg)