ViewTube

ViewTube
Sign inSign upSubscriptions
Filters

Upload date

Type

Duration

Sort by

Features

Reset

2,330 results

Universitat Politècnica de València - UPV
Introduction to Matplotlib | 31/77 | UPV

Title: Introduction to Matplotlib Auto-description: This video introduces Matplotlib, focusing on the importance of data ...

3:19
Introduction to Matplotlib | 31/77 | UPV

923 views

3 years ago

pychallenger
🐍 All Python Programmers Should Know This Matplotlib Life Hack #python #shorts

Matplotlib shortcut every Python programmer and Data Scientist needs to know! Learn how to effortlessly style your plots with ...

0:47
🐍 All Python Programmers Should Know This Matplotlib Life Hack #python #shorts

496 views

1 year ago

ModernPython
Change Matplotlib legend size #matplotlib #shorts

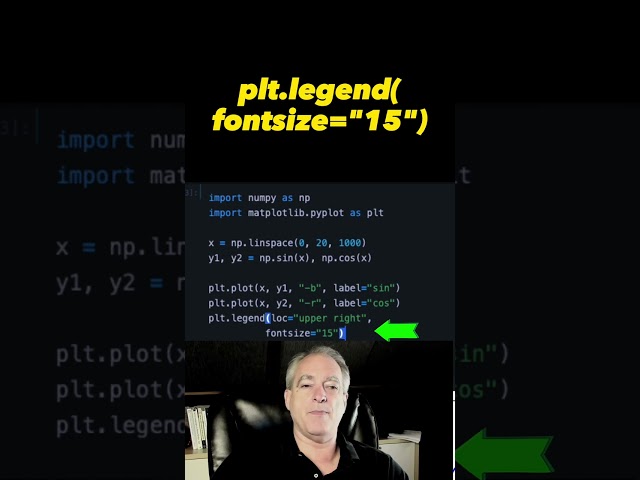
This video will show you how to control the Matplotlib legend size by controlling the font size used in the legend.

0:15
Change Matplotlib legend size #matplotlib #shorts

512 views

2 years ago

Koolac
How to plot scatter plot in Matplotlib Python programming

... your questions in the comments below, which I will definitely upload videos for frequently asked questions. my matplotlib tutorial ...

2:06
How to plot scatter plot in Matplotlib Python programming

547 views

5 years ago

Alex.J "JAX"
Python Matplotlib ‼️ BAR CHART 📊 Explained ✅ in UNDER 60 SECONDS ⏱️🔥#python #coding #tutorial

Matplotlib python #short #tutorial - on basics of creating bar chart which is best suited for comparing categorical data.

1:00
Python Matplotlib ‼️ BAR CHART 📊 Explained ✅ in UNDER 60 SECONDS ⏱️🔥#python #coding #tutorial

235 views

2 years ago

Amit Thinks
1. Matplotlib Introduction & Features| Python Matplotlib Tutorial for Beginners | Amit Thinks

In this lesson, learn what is Matplotlib with its features. Matplotlib is an open-source plotting library developed by John D. Hunter.

2:25
1. Matplotlib Introduction & Features| Python Matplotlib Tutorial for Beginners | Amit Thinks

24,196 views

1 year ago

ModernPython
Adding titles to each Matplotlib subplot #matplotlib #shorts

Use the axes to add titles to each subplot in Matplotlib.

0:14
Adding titles to each Matplotlib subplot #matplotlib #shorts

280 views

2 years ago

RiskByNumbers
Probability Distribution Fitting in Python in Just 60 Seconds!

How can you actually fit data to a probability distribution in practice? Today, I provide a 60 second tutorial on how to do so in ...

1:00
Probability Distribution Fitting in Python in Just 60 Seconds!

21,439 views

2 years ago

ModernPython
Control x/y axis range in Matplotlib 📈 #shorts #matplotlib

In order to control what range is shown on your Matplotlib plot, you have to grab the current axes using plt.gca(). Then use this ...

0:40
Control x/y axis range in Matplotlib 📈 #shorts #matplotlib

341 views

2 years ago

ModernPython
Setting specific color when plotting in Matplotlib

This video will show how to control what color each plot is when using Matplotlib.

0:13
Setting specific color when plotting in Matplotlib

510 views

2 years ago

ModernPython
Remove axis in a Matplotlib plot #matplotlib #shorts

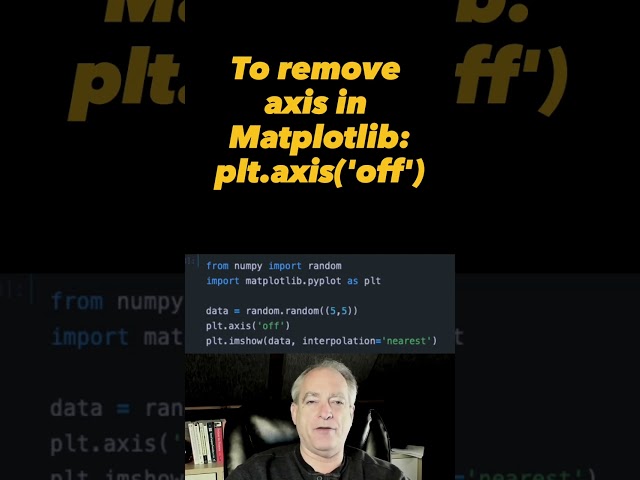
In this super short video, I show you how to remove the axis when plotting in Matplotlib. Useful for when your are plotting image ...

0:12
Remove axis in a Matplotlib plot #matplotlib #shorts

318 views

2 years ago

Visual Studio Code
Jupyter Notebooks Tutorial: How to save a Matplotlib chart as an image with 1 click

Hang out to the end for the "one click" solution... More savefig options: ...

2:04
Jupyter Notebooks Tutorial: How to save a Matplotlib chart as an image with 1 click

15,135 views

3 years ago

ModernPython
Change Matplotlib tick frequency 📈 #shorts

Use plt.xticks() and plt.yticks() to specify which numbers have tick marks on your plots.

0:34
Change Matplotlib tick frequency 📈 #shorts

648 views

2 years ago

ModernPython
Plot LOGarithmic axis in Matplotlib 📈 #shorts #matplotlib

In this short video, I show you how to create a plot on a logarithmic axis in Matplotlib. You can grab the current axis with plt.gca().

0:17
Plot LOGarithmic axis in Matplotlib 📈 #shorts #matplotlib

507 views

2 years ago

ModernPython
Control figure size in Matplotlib subplots 📈 #matplotlib #python #shorts

The figure is the overall size that all subplots are drawn on. You can pass in figsize parameter when creating subplots to control ...

0:22
Control figure size in Matplotlib subplots 📈 #matplotlib #python #shorts

853 views

2 years ago

Koolac
How to plot Stock Candlestick Chart with 2 lines of Code in Python

Tutorial on How to plot Stock Candlestick Chart with 2 lines of Code in Python. In this video we will use plotly module (package) in ...

2:24
How to plot Stock Candlestick Chart with 2 lines of Code in Python

1,075 views

3 years ago

Code Preview
Streaming graph from API data using matplotlib python library

It'll show streaming of data from API data and creating graph using matplotlib library. It's simple demo to understand way of ...

2:01
Streaming graph from API data using matplotlib python library

640 views

8 years ago

Koolac
Matplotlib Bar Chart (bar plot) in Python + example

Tutorial on plotting a bar chart (bar plot or bar graph) in matplotlib in Python programming language + example [from scratch in ...

3:54
Matplotlib Bar Chart (bar plot) in Python + example

876 views

5 years ago

ModernPython
Control font size for your ticks in Matplotlib 📈 #matplotlib #shorts

In this video, we'll show you how to control the font size of your ticks in Matplotlib. By adjusting the font size, you can control the ...

0:25
Control font size for your ticks in Matplotlib 📈 #matplotlib #shorts

197 views

2 years ago

DESI ASTRO
Matplotlib Tutorial: Switching Off Axes and Ticks  Python | Python for Data Science & Visualization

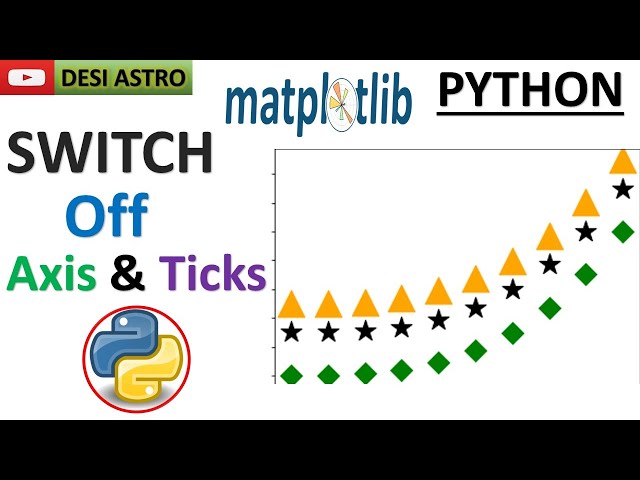
To remove the axis and ticks in matplotlib plots, you can use specific functions to disable them. Here's how you can achieve this: ...

3:53
Matplotlib Tutorial: Switching Off Axes and Ticks Python | Python for Data Science & Visualization

178 views

1 year ago