Upload date
All time
Last hour
Today
This week
This month
This year
Type
All
Video
Channel
Playlist
Movie
Duration
Short (< 4 minutes)
Medium (4-20 minutes)
Long (> 20 minutes)
Sort by
Relevance
Rating
View count
Features
HD
Subtitles/CC
Creative Commons
3D
Live
4K
360°
VR180
HDR
4,719 results
Dive into the world of data visualization with this comprehensive guide to mastering Matplotlib in Python! In this tutorial, we'll ...
57 views
3 years ago
269 views
4 years ago
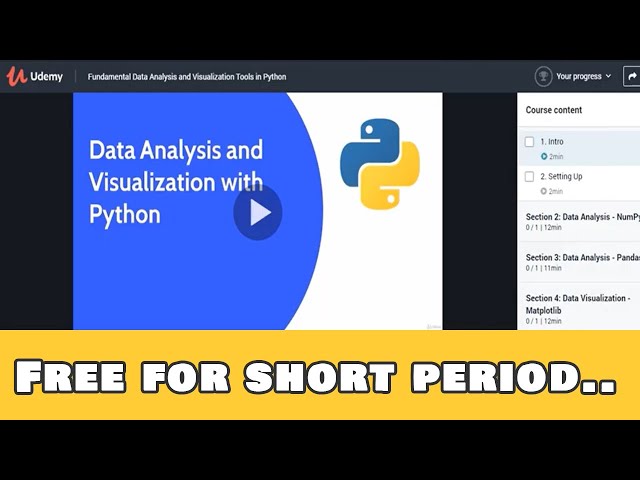
Get this course for free: Fundamental Data Analysis and Visualization Tools in Python: https://bit.ly/3kFOAPD Learn the ...
65 views
5 years ago
Today's video is about the Quicksort algorithm. It's a sorting algorithm. It goes like this: First, it chooses an element, called a pivot, ...
195 views
Learn about the Data Science Pipeline with the National Student Data Corps! The fifth step in the Data Science Pipeline is Data ...
221 views
2 years ago
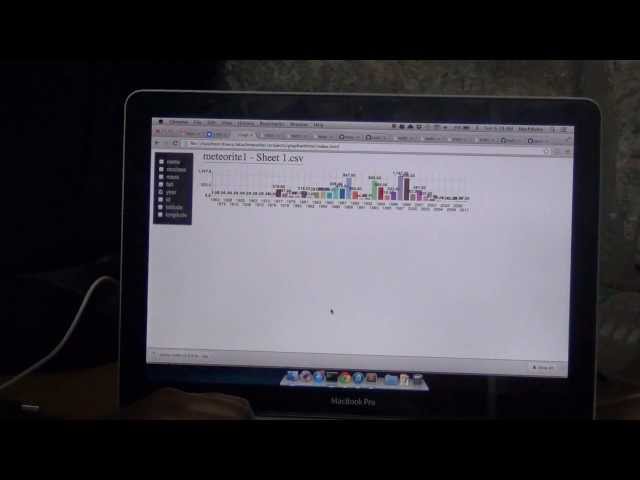
This project was executed and demonstrated at The Fifth Elephant data visualization hacknight held on 29th and 39th June.
67 views
12 years ago
In this video, we'll explore how to create two horizontal bar charts side by side using Python's Pandas library. Visualizing data ...
13 views
1 year ago
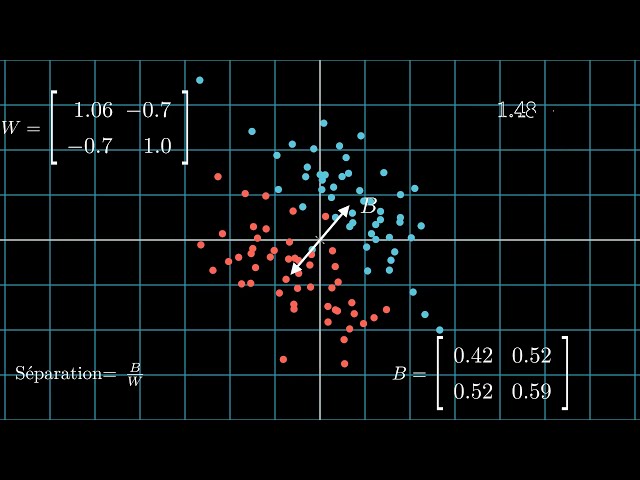
In this video, we'll explore the powerful combination of colormaps and colored quiver plots in Python's Matplotlib library. You'll ...
24 views
Welcome to this Python project tutorial where we dive into the fascinating world of data visualization! In this video, we will guide ...
5 views
In this video, we dive into the powerful capabilities of Matplotlib, a popular plotting library in Python. We'll explore how to create a ...
38 views
Example of an animation with various subplots and axes using Python and Matplotlib.
21,489 views
13 years ago
Jian Yu, MS, discusses the roles of Python and SQL in database management and analysis, and how Tableau is used for data ...
2 views
9 months ago
Overview of lesson covering visualization with pandas and Matplotlib.
40 views
49 views
This project was being worked on at The Fifth Elephant data visualization hacknight held on 29th and 39th June. The data ...
23 views
51 views
102 views
Welcome to our Python project tutorial where we'll explore the exciting world of data visualization. In this video, we'll guide you ...
9 views