ViewTube

ViewTube
Sign inSign upSubscriptions
Filters

Upload date

Type

Duration

Sort by

Features

Reset

532 results

Learn With Hiro
Python Project : Bar Graph using Matplotlib in Python || Code Practice for beginners

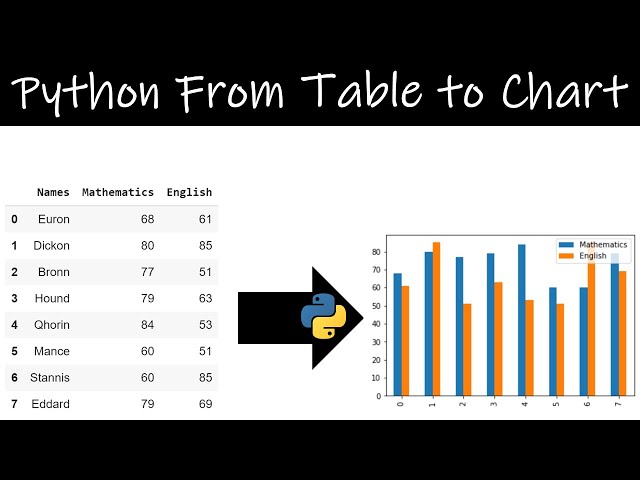
Welcome to this Python project tutorial where we dive into the fascinating world of data visualization! In this video, we will guide ...

1:35
Python Project : Bar Graph using Matplotlib in Python || Code Practice for beginners

5 views

2 years ago

Sujeet Kumar Advanced Excel Training in Hindi
Plot Graphs in Python in 1 Line! #matplotlib #python #visualization #shorts

Download Excel VBA MIS Learning - App - https://play.google.com/store/apps/details?id=co.hodor.jqijz iOS ...

1:05
Plot Graphs in Python in 1 Line! #matplotlib #python #visualization #shorts

5 views

1 month ago

Vanderbilt Digital Lab
010g What is pyplot?

Introduction to plotting - What is pyplot?

1:46
010g What is pyplot?

191 views

5 years ago

Codanics
Datascience Roadmap with python in urdu/hindi #shorts

datascience #pythonkachilla #python #datascience #pythonkachilla #python #dataanalytics #pythonforbeginners ...

1:01
Datascience Roadmap with python in urdu/hindi #shorts

617 views

3 years ago

Roel Van de Paar
A matplotlib scatter function inside a for loop

A matplotlib scatter function inside a for loop Helpful? Please support me on Patreon: https://www.patreon.com/roelvandepaar ...

2:29
A matplotlib scatter function inside a for loop

65 views

3 years ago

Isidro González
Evolution of the fit to a gaussian distributed measurement

This video shows how the fit to a probabilistic distribution improves as more values are used. This example uses random numbers ...

0:13
Evolution of the fit to a gaussian distributed measurement

106 views

6 years ago

Roel Van de Paar
Plotting shapely polygon in matplotlib

Plotting shapely polygon in matplotlib Helpful? Please support me on Patreon: https://www.patreon.com/roelvandepaar With ...

3:01
Plotting shapely polygon in matplotlib

84 views

3 years ago

Sasyuk
#Noisevember 09 MEGADRONE #python #simpleaudio #matplotlib

Today I decided that I needed my own scalable N-oscilator megadrone. Like other people ...

0:59
#Noisevember 09 MEGADRONE #python #simpleaudio #matplotlib

206 views

5 years ago

COMPUTER & EXCEL SOLUTION
Create a function to find prime number in python in hindi@COMPUTEREXCELSOLUTION

Join this channel to get access to perks: https://www.youtube.com/channel/UC4C_tfy6WLDxzVVO3y6YinA/join This is my ...

0:51
Create a function to find prime number in python in hindi@COMPUTEREXCELSOLUTION

67 views

2 years ago

Apratim Tripathi
Section Overview MATplotlib and data visualisation
1:51
Section Overview MATplotlib and data visualisation

3 views

4 years ago

Peter Schneider
TypeError: barplot() takes from 0 to 1 positional arguments but 2 were given

TypeError: barplot() takes from 0 to 1 positional arguments but 2 were given [duplicate] I hope you found a solution that worked for ...

2:47
TypeError: barplot() takes from 0 to 1 positional arguments but 2 were given

3,106 views

2 years ago

Pro Bono
Plot Table Data to Chart Using Pandas | Pandas Library | Python

Plot Table Data to Chart Pandas Library Dataframe multiple colum graph plot Python.

3:32
Plot Table Data to Chart Using Pandas | Pandas Library | Python

206 views

5 years ago

Codanics
Assignment Alert

machinelearning #ml101 #machinelearningfullcourse #machinelearningwithpython #datascience #codanics #artificialintelligence ...

1:55
Assignment Alert

1,787 views

2 years ago

simplitraining
2.002 EDA-Graphical Technique

datascience #whatisdatascience #datascienceforbeginners #python #datasciencewithpython #datascienceforbeginners #youtube ...

0:58
2.002 EDA-Graphical Technique

601 views

3 years ago

Roel Van de Paar
GIS: Plotting cross section using python, gdal, tiff? (2 Solutions!!)

GIS: Plotting cross section using python, gdal, tiff? Helpful? Please support me on Patreon: ...

3:27
GIS: Plotting cross section using python, gdal, tiff? (2 Solutions!!)

42 views

4 years ago

Roel Van de Paar
Unix & Linux: How to plot a CDF from array using matplotlib python?

Unix & Linux: How to plot a CDF from array using matplotlib python? Helpful? Please support me on Patreon: ...

2:11
Unix & Linux: How to plot a CDF from array using matplotlib python?

4 views

5 years ago

Codanics
Cross Validation in machine learning (Part-2)

machinelearning #ml101 #machinelearningfullcourse #machinelearningwithpython #datascience #codanics #artificialintelligence ...

2:24
Cross Validation in machine learning (Part-2)

1,323 views

2 years ago

Roel Van de Paar
Ubuntu: Python matplotlib - ImportError: No module named functools_lru_cache

Ubuntu: Python matplotlib - ImportError: No module named functools_lru_cache Helpful? Please support me on Patreon: ...

1:21
Ubuntu: Python matplotlib - ImportError: No module named functools_lru_cache

72 views

6 years ago

Peter Schneider
Euler's Method from Python to Mathematica

Euler's Method from Python to Mathematica [duplicate] I hope you found a solution that worked for you :) The Content (except ...

3:52
Euler's Method from Python to Mathematica

74 views

3 years ago

Roel Van de Paar
Ubuntu: Python 2.7 matplotlib provides error? (2 Solutions!!)

Ubuntu: Python 2.7 matplotlib provides error? (2 Solutions!) Helpful? Please support me on Patreon: ...

1:57
Ubuntu: Python 2.7 matplotlib provides error? (2 Solutions!!)

9 views

5 years ago

DerPlasma
Signal with single frequency

Signal with a single frequency. Animation produced with python's matplotlib.animation. Responsible: Alf Köhn-Seemann Social: ...

0:27
Signal with single frequency

269 views

3 years ago

Codanics
Group prediction with meta-estimators (3/3)

datascience #pythonkachilla #python #datascience #pythonkachilla #python #dataanalytics #pythonforbeginners ...

2:52
Group prediction with meta-estimators (3/3)

231 views

3 years ago

Roel Van de Paar
matplotlib not working in Pycharm 4.5.3

matplotlib not working in Pycharm 4.5.3 Helpful? Please support me on Patreon: https://www.patreon.com/roelvandepaar With ...

1:53
matplotlib not working in Pycharm 4.5.3

65 views

5 years ago

Roel Van de Paar
Raspberry Pi: How to install python3-matplotlib on RasPi? (5 Solutions!!)

Raspberry Pi: How to install python3-matplotlib on RasPi? Helpful? Please support me on Patreon: ...

3:07
Raspberry Pi: How to install python3-matplotlib on RasPi? (5 Solutions!!)

172 views

5 years ago

Roel Van de Paar
GIS: Reading .tiff data using Python

GIS: Reading .tiff data using Python Helpful? Please support me on Patreon: https://www.patreon.com/roelvandepaar With thanks ...

2:27
GIS: Reading .tiff data using Python

530 views

4 years ago