ViewTube

ViewTube
Sign inSign upSubscriptions
Filters

Upload date

Type

Duration

Sort by

Features

Reset

2,887 results

Michel van Biezen
Electrical Engineering: Ch 15: Frequency Response (21 of 56) Bode Plot: Zero at the Origin

Visit http://ilectureonline.com for more math and science lectures! We will have a more detailed look at what the transfer function ...

2:32
Electrical Engineering: Ch 15: Frequency Response (21 of 56) Bode Plot: Zero at the Origin

44,314 views

6 years ago

University of Utah: Professor Angela Rasmussen
Interpreting Bode Plots

... Department of Electrical and Computer Engineering so today I wanted to talk about interpreting bode plots so on this bode plot ...

2:50
Interpreting Bode Plots

624 views

6 years ago

Michel van Biezen
Electrical Engineering: Ch 15: Frequency Response (22 of 56) Bode Plot: Pole at the Origin

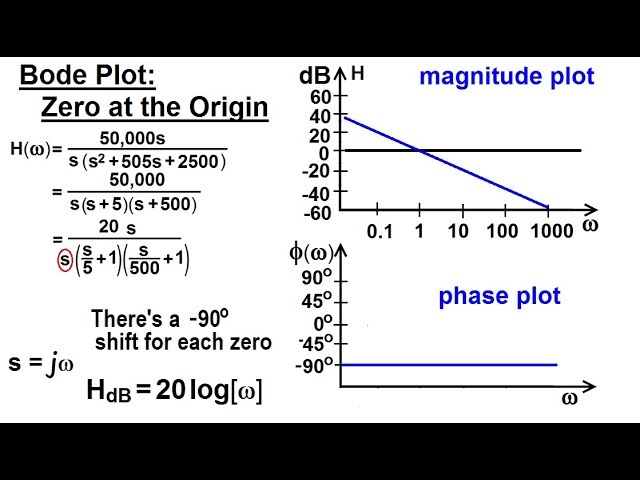
Visit http://ilectureonline.com for more math and science lectures! We will look at the Bode plot for poles at the origin (exact ...

1:56
Electrical Engineering: Ch 15: Frequency Response (22 of 56) Bode Plot: Pole at the Origin

40,657 views

6 years ago

Peter Schneider
Why can the Bode plots of transfer functions have negative magnitude values?

Why can the Bode plots of transfer functions have negative magnitude values? I hope you found a solution that worked for you ...

2:57
Why can the Bode plots of transfer functions have negative magnitude values?

53 views

3 years ago

Bingsen Wang
Bode plots of transfer functions: magnitude plots
0:09
Bode plots of transfer functions: magnitude plots

2,430 views

6 months ago

Kowsi Teaches
How to ✍️ phase angle expression in Bode Plot?

Hello viewers today we are going to discuss about how to write the expression for phase angle in Bode plot so this is our given ...

0:59
How to ✍️ phase angle expression in Bode Plot?

15,223 views

2 years ago

Gate Preparation
The bode plot of transfer function GS

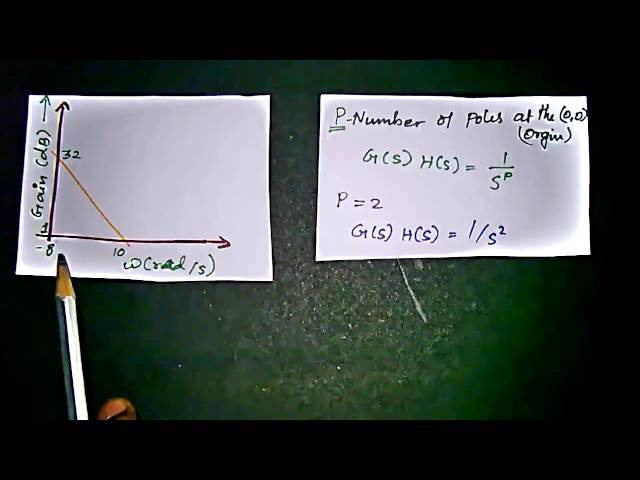
The bode plot of transfer function G(S) is shown in the figure in video. The Gain (20 log |G(S)|) is 32 db and -8 db at 1 rad/s and 10 ...

3:56
The bode plot of transfer function GS

536 views

11 years ago

Kowsi Teaches
How to find corner frequencies from the given transfer function (Bode plot)

A system has GS HS = K. S (S+2) ( S+4) (S+8) Draw the Root Locus plot.

1:01
How to find corner frequencies from the given transfer function (Bode plot)

20,521 views

2 years ago

Bingsen Wang
A lead compensator vs a lag compensator: the transfer function with one zero and one pole
0:09
A lead compensator vs a lag compensator: the transfer function with one zero and one pole

3,422 views

6 months ago

Michel van Biezen
Electrical Engineering: Ch 15: Frequency Response (20 of 56) Bode Plot: The Constant Gain

Visit http://ilectureonline.com for more math and science lectures! We will example the first, also the easiest, factor of the Bode plot: ...

2:05
Electrical Engineering: Ch 15: Frequency Response (20 of 56) Bode Plot: The Constant Gain

43,078 views

6 years ago

AllAboutEE
MATLAB: How To Make a Bode Plot

http://allaboutee.com Learn to make a bode plot out of a transfer function in MATLAB.

2:05
MATLAB: How To Make a Bode Plot

15,460 views

14 years ago

Kowsi Teaches
To find Gain margin and Phase margin in Bode plot

Hello viewers today we are going to see what is space merger and gain margin in a bode plot this is the magnitude plot and this is ...

1:01
To find Gain margin and Phase margin in Bode plot

52,802 views

2 years ago

Michel van Biezen
Electrical Engineering: Ch 15: Frequency Response (23 of 56) Bode Plot: Simple Zero

Visit http://ilectureonline.com for more math and science lectures! We will take a closer look at what a Bode plot looks like for a ...

2:00
Electrical Engineering: Ch 15: Frequency Response (23 of 56) Bode Plot: Simple Zero

43,499 views

6 years ago

Kowsi Teaches
How to arrange the terms in the table to find change in slope?(Bode Plot)

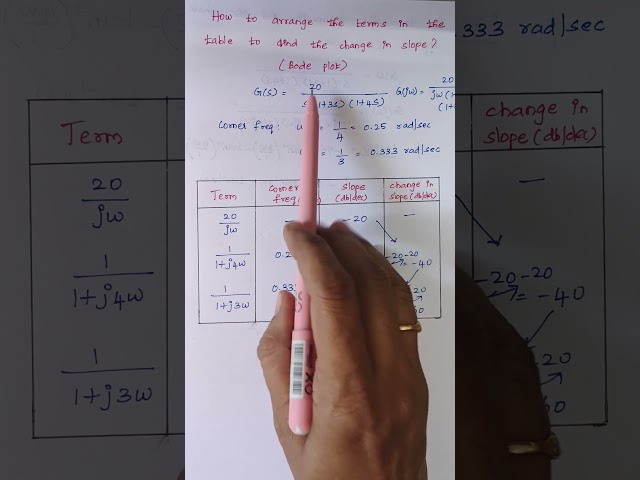
... going to discuss about how to arrange the terms in the table in Bode plot right so this is the given transfer function the first step is ...

1:01
How to arrange the terms in the table to find change in slope?(Bode Plot)

40,218 views

2 years ago

Chirantan Ganguly
Drawing Bode Plot of a given Transfer Function (Computationally) | Control Systems | GNU Octave

Drawing Bode Plots of a given Transfer Function (T.F.), computationally using the control package of GNU Octave.

2:21
Drawing Bode Plot of a given Transfer Function (Computationally) | Control Systems | GNU Octave

1,783 views

4 years ago

Vedant Gupta
SigFlow- Transfer function bode plot

This video demonstrates the transfer function bode plot feature.

0:22
SigFlow- Transfer function bode plot

10 views

11 months ago

Homework
Find the transfer function with the Bode magnitude plot shown in Fig. 14.71

Find the transfer function with the Bode magnitude plot shown in Fig. 14.71.

3:07
Find the transfer function with the Bode magnitude plot shown in Fig. 14.71

56 views

2 months ago

Rohde & Schwarz
R&S RTM3000 oscilloscope: Measuring filter transfer functions with the Bode plot tool

Watch this video to see how to perform a Bode plot frequency response analysis with the R&S RTM3000 oscilloscope.

2:13
R&S RTM3000 oscilloscope: Measuring filter transfer functions with the Bode plot tool

2,166 views

6 years ago

GNANASELVAN D URK24RA3008
BODE PLOT FOR A GIVEN TRANSFER FUNCTION OF THE SYSTEM
1:25
BODE PLOT FOR A GIVEN TRANSFER FUNCTION OF THE SYSTEM

1 view

2 months ago

EEMCQs
EEMCQs || Control System || Reconstructing Transfer Function from BODE Magnitude Plot || Tutorial-I

GATE #UPSC #IES #PSC #AE This tutorial video Reconstructing Transfer Function from BODE Magnitude Plot What you will learn ...

3:31
EEMCQs || Control System || Reconstructing Transfer Function from BODE Magnitude Plot || Tutorial-I

352 views

7 years ago