Upload date
All time
Last hour
Today
This week
This month
This year
Type
All
Video
Channel
Playlist
Movie
Duration
Short (< 4 minutes)
Medium (4-20 minutes)
Long (> 20 minutes)
Sort by
Relevance
Rating
View count
Features
HD
Subtitles/CC
Creative Commons
3D
Live
4K
360°
VR180
HDR
126,387 results
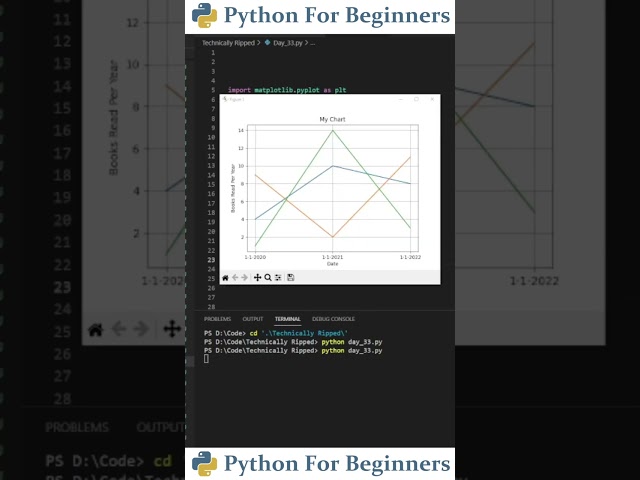
In this video we'll go over the Matplotlib library for Python. Matplotlib is a popular library for creating graphs, plots, and other data ...
162,868 views
5 years ago
In this video, we dive deep into the world of data visualization in Python using three powerful libraries: Matplotlib, Seaborn, and ...
1,533 views
1 year ago
When You Learn Python please make sure that you don't go away and do endless General programming tutorials I've done that ...
113,074 views
https://osmangul.com/2023/03/28/simple-real-time-force-sensor-serial-data-plotting-in-python-matplotlib/
34,490 views
2 years ago
Matplotlib Explained in 100 Secs | Python Plotting for Beginners #MatplotlibPython #Matplotlib #MatplotlibPythonTutorial ...
44,374 views
6 months ago
3,067 views
137,443 views
Matplotlib vs Seaborn vs Plotly: Best Python Visualization Tools.
2,370 views
2 months ago
In this video I show you how to plot multiple lines using the matplotlib library in Python, and how to change the line's color #coding ...
3,054 views
In this lesson, learn what is Matplotlib with its features. Matplotlib is an open-source plotting library developed by John D. Hunter.
23,984 views
Matplotlib is the most fundamental and widely used data visualization library in Python, forming the backbone of libraries like ...
685 views
Join me on Day 3/100 of my Python journey as I dive into Matplotlib, the powerful library for creating stunning data visualizations!
44,270 views
6,263 views
Hello guys, Welcome to my channel Mr. Scientist..... #shorts #python #pythonprogramming #coding #mrscientist #coding ...
26,966 views
3 years ago
Code: https://github.com/aviwcodes/youtube-shorts/blob/master/plot_shorts/05%20Triangular%203D%20surfaces.py.
4,650 views
Learn how to use Matplotlib markers in Python for better data visualization. This quick Python plotting tutorial shows different ...
264 views
Tags : #oualicode #python#shorts #oualicode #coding #3d python turtle graphics tutorial python turtle tutorial python turtle ...
18,794 views
6,387 views
11 months ago
datavisualization #datascience #python #matplotlib #pythonprogramming #machinelearning #ai #artificialintelligence ...
17,675 views
How to create subplots using for loop in matplotlib #matplotlib #python #datascience.
795 views