ViewTube

ViewTube
Sign inSign upSubscriptions
Filters

Upload date

Type

Duration

Sort by

Features

Reset

4,450 results

Kite
HOW TO USE Matplotlib in 4 MINUTES (2020 Python Tutorial)

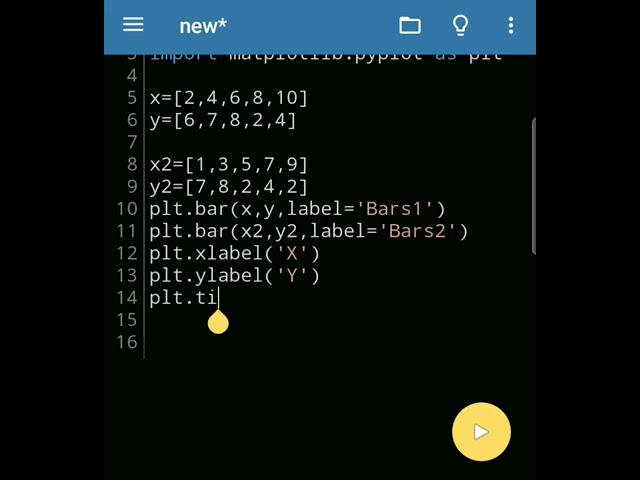
In this video we'll go over the Matplotlib library for Python. Matplotlib is a popular library for creating graphs, plots, and other data ...

3:54
HOW TO USE Matplotlib in 4 MINUTES (2020 Python Tutorial)

168,577 views

5 years ago

Sneha IITian
Plot a #double #bar #graph 📊 #Python

Music Credits Music Cuba Musician ASHUTOSH Link to Python Basics: ...

0:30
Plot a #double #bar #graph 📊 #Python

7,651 views

4 years ago

TechnicallyRipped
Matplotlib Trick to Control Tick Marks | Python Tutorial

Learn how to control the number of ticks on your y-axis using MaxNLocator in Matplotlib. This simple trick keeps your charts clean ...

1:04
Matplotlib Trick to Control Tick Marks | Python Tutorial

1,578 views

3 months ago

Chirag Dudhat
How I make my animations using python~matplotlib #satisfying #mathematics #python #programming
0:41
How I make my animations using python~matplotlib #satisfying #mathematics #python #programming

145,974 views

1 year ago

The Code City
How to Install Matplotlib in Python 3.12 (2024)

In this video, I'll show you how you can Install Matplotlib in Python 3.12. Matplotlib is a popular python library that is used for ...

1:48
How to Install Matplotlib in Python 3.12 (2024)

17,071 views

1 year ago

Intellipaat
🔥Matplotlib Explained in 100 Secs | Python Plotting for Beginners | Intellipaat #shorts

Matplotlib Explained in 100 Secs | Python Plotting for Beginners #MatplotlibPython #Matplotlib #MatplotlibPythonTutorial ...

0:45
🔥Matplotlib Explained in 100 Secs | Python Plotting for Beginners | Intellipaat #shorts

53,215 views

7 months ago

Osman Gul
Simple Real-Time Force Sensor Serial Data Plotting in Python (Matplotlib)

https://osmangul.com/2023/03/28/simple-real-time-force-sensor-serial-data-plotting-in-python-matplotlib/

0:08
Simple Real-Time Force Sensor Serial Data Plotting in Python (Matplotlib)

37,222 views

2 years ago

Progma Engineer
Draw a Line in Python | Matplotlib Pyplot | Data Science Tutorial

Learn how to draw a line in Python using Matplotlib Pyplot for data science projects! This short tutorial shows you how to create ...

0:22
Draw a Line in Python | Matplotlib Pyplot | Data Science Tutorial

984 views

4 months ago

TechnicallyRipped
How to Add a Matplotlib Plots to Tkinter | Python Tutorial

Learn how to embed Matplotlib plots directly into a Tkinter window. This allows you to visualize data, create charts, and make ...

1:07
How to Add a Matplotlib Plots to Tkinter | Python Tutorial

2,434 views

3 months ago

Dimas
🟡PYTHON with MATPLOTLIB: Multiple charts Do you already know how to do this?

Do you want to learn how to use Python with Matplotlib? Discover how to generate multiple graphs with data extracted from a ...

0:42
🟡PYTHON with MATPLOTLIB: Multiple charts Do you already know how to do this?

18,286 views

4 years ago

Anas Dharar
How to make Pie chart in python| python Matplotlib tutorial

In this video I will show you how you can make pie chart in just 5 lines in python Do watch the full video Code: from matplotlib ...

1:31
How to make Pie chart in python| python Matplotlib tutorial

662 views

3 years ago

The Data Analyst
Data Visualization using Python Matplotlib Library | Data Science | #datascience #dataanalytics

datavisualization #datascience #python #matplotlib #pythonprogramming #machinelearning #ai #artificialintelligence ...

0:14
Data Visualization using Python Matplotlib Library | Data Science | #datascience #dataanalytics

18,764 views

2 years ago

WorldInData
How to add a GRID to a Matplotlib Figure |  Python Tutorial 07

In this Matplotlib/Python tutorial we will show you how to create and use grids in your figures in an easy way. Hence, in this tutorial ...

3:06
How to add a GRID to a Matplotlib Figure | Python Tutorial 07

238 views

3 years ago

The Why Guy
Day 3/100: Mastering Data Visualization with Matplotlib in Python #Matplotlib #100daysofcode

Join me on Day 3/100 of my Python journey as I dive into Matplotlib, the powerful library for creating stunning data visualizations!

0:19
Day 3/100: Mastering Data Visualization with Matplotlib in Python #Matplotlib #100daysofcode

53,711 views

1 year ago

Mo Chen
How to learn Python fast for data analysis? #dataanalyst #python #pandas #numpy #matplotlib

When You Learn Python please make sure that you don't go away and do endless General programming tutorials I've done that ...

0:43
How to learn Python fast for data analysis? #dataanalyst #python #pandas #numpy #matplotlib

121,785 views

1 year ago

tech zone
python matplotlib consept | matplotlib.pyplot tutorial
0:10
python matplotlib consept | matplotlib.pyplot tutorial

506 views

2 years ago

Amit Thinks
How to Run Matplotlib Online (without installing)

In this video, learn how to run Matplotlib Online. We will use an online tool to import the Matplotlib library and run programs.

2:24
How to Run Matplotlib Online (without installing)

4,235 views

3 years ago

CodeVisium
Matplotlib Explained | The Foundation of Python Data Visualization #Matplotlib #DataScience

Matplotlib is the most fundamental and widely used data visualization library in Python, forming the backbone of libraries like ...

0:06
Matplotlib Explained | The Foundation of Python Data Visualization #Matplotlib #DataScience

751 views

3 months ago

Amit Thinks
How to install Matplotlib in VS Code | Updated 2024 | Amit Thinks

Learn how to download and install the Matplotlib library on VS Code. Matplotlib is an open-source plotting library developed by ...

1:33
How to install Matplotlib in VS Code | Updated 2024 | Amit Thinks

16,069 views

1 year ago

Learn Coding Skills
Plot Points on Graph using matplotlib in Python! #shorts #programming #coding
0:17
Plot Points on Graph using matplotlib in Python! #shorts #programming #coding

13,206 views

3 years ago